Komitet Wyborczy Stowarzyszenia Przyjazny Powiat
| Name: | Komitet Wyborczy Stowarzyszenia Przyjazny Powiat | |
| Short name: | KW Stowarzyszenia Przyjazny Powiat | |
| Type of committee: | Election committees established by organisations | |
| Address: | Złotno 10 B 57-340 Duszniki Zdrój | |
| Plenipotentiary: | electoral | financial |
| Lesław Łysiak | Małgorzata, Józefa Porębska | |
The provinces where the committee has submitted lists of candidates
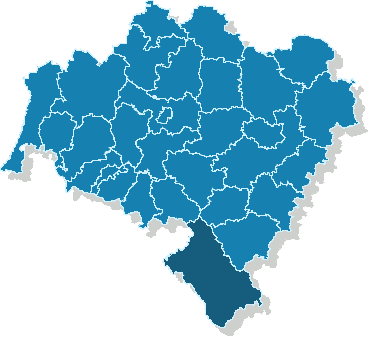
| Name |
|---|
| pow. kłodzki |
The statistics of election committe
Lists submitted
| Description | Number of |
|---|---|
| Number of lists submitted for province council | 0 |
| Number of lists submitted for county councils | 7 |
| Number of lists submitted for councils of cities holding county rights | 0 |
| Number of lists submitted for districts councils of the cap. city of Warsaw | 0 |
| Number of lists registered for communal councils | 7 |
| Totalling | 14 |
Submitted candidates
| Name | Number of candidates | Women | Women (%) | Men | Men (%) |
|---|---|---|---|---|---|
| Number of candidates submitted for the province council | 0 | 0 | - | 0 | - |
| Number of candidates submitted for county councils | 53 | 22 | 41.51% | 31 | 58.49% |
| Number of candidates submitted for councils of cities holding county rights | 0 | 0 | - | 0 | - |
| Number of candidates submitted for districts councils of the cap. city of Warsaw | 0 | 0 | - | 0 | - |
| Number of candidates registered for communal councils | 7 | 5 | 71.43% | 2 | 28.57% |
| Number of candidates submitted for reeve, mayor and presidential elections | 0 | 0 | - | 0 | - |
| Totalling | 60 | 27 | 45.00% | 33 | 55.00% |
Average age of submitted candidates
| Name | Average age | Average age of women | Average age of men |
|---|---|---|---|
| Average age of candidates submitted for the province council | - | - | - |
| Average age of candidates submitted for county councils | 48 | 46 | 49 |
| Average age of candidates for councils of cities holding county rights | - | - | - |
| Average age of candidates for districts councils of the cap. city of Warsaw | - | - | - |
| Average age of candidates submitted for communal councils | 44 | 41 | 52 |
| Average age of candidates for reeve, mayor, president | - | - | - |
| Totalling | 47 | 45 | 50 |
Submitted candidates grouped by age
| Name | Number of candidates | Women | Women (%) | Men | Men (%) |
|---|---|---|---|---|---|
| 18-29 | 5 | 2 | 40.00% | 3 | 60.00% |
| 30-39 | 9 | 6 | 66.67% | 3 | 33.33% |
| 40-49 | 15 | 7 | 46.67% | 8 | 53.33% |
| 50-59 | 23 | 9 | 39.13% | 14 | 60.87% |
| 60-69 | 5 | 3 | 60.00% | 2 | 40.00% |
| 70+ | 3 | 0 | 0.00% | 3 | 100.00% |
The youngest and oldest candidate submitted
| Age | Institution | |
|---|---|---|
| Youngest | 26 | Rada Powiatu Kłodzkiego |
| Oldest | 74 | Rada Powiatu Kłodzkiego |