Komitet Wyborczy Wyborców Zgoda
| Name: | Komitet Wyborczy Wyborców Zgoda | |
| Short name: | KWW Zgoda | |
| Type of committee: | Election committees established by electors | |
| Address: | Budowlana 4, 88-101, Inowrocław | |
| Plenipotentiary: | electoral | financial |
| Jerzy Borowiak | Wojciech Józef Domański | |
The provinces where the committee has submitted lists of candidates
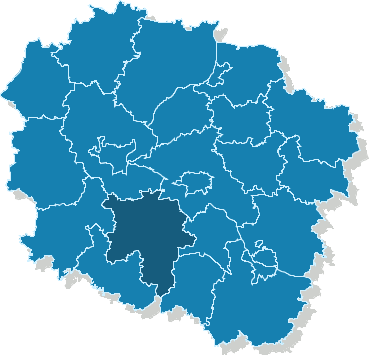
| Name |
|---|
| pow. inowrocławski |
The statistics of election committe
Lists submitted
| Description | Number of |
|---|---|
| Number of lists submitted for province council | 0 |
| Number of lists submitted for county councils | 7 |
| Number of lists submitted for councils of cities holding county rights | 0 |
| Number of lists submitted for districts councils of the cap. city of Warsaw | 0 |
| Number of lists registered for communal councils | 15 |
| Totalling | 22 |
Submitted candidates
| Name | Number of candidates | Women | Women (%) | Men | Men (%) |
|---|---|---|---|---|---|
| Number of candidates submitted for the province council | 0 | 0 | - | 0 | - |
| Number of candidates submitted for county councils | 40 | 9 | 22.50% | 31 | 77.50% |
| Number of candidates submitted for councils of cities holding county rights | 0 | 0 | - | 0 | - |
| Number of candidates submitted for districts councils of the cap. city of Warsaw | 0 | 0 | - | 0 | - |
| Number of candidates registered for communal councils | 67 | 19 | 28.36% | 48 | 71.64% |
| Number of candidates submitted for reeve, mayor and presidential elections | 2 | 0 | 0.00% | 2 | 100.00% |
| Totalling | 109 | 28 | 25.69% | 81 | 74.31% |
Average age of submitted candidates
| Name | Average age | Average age of women | Average age of men |
|---|---|---|---|
| Average age of candidates submitted for the province council | - | - | - |
| Average age of candidates submitted for county councils | 45 | 41 | 47 |
| Average age of candidates for councils of cities holding county rights | - | - | - |
| Average age of candidates for districts councils of the cap. city of Warsaw | - | - | - |
| Average age of candidates submitted for communal councils | 42 | 43 | 42 |
| Average age of candidates for reeve, mayor, president | 38 | - | 38 |
| Totalling | 43 | 42 | 44 |
Submitted candidates grouped by age
| Name | Number of candidates | Women | Women (%) | Men | Men (%) |
|---|---|---|---|---|---|
| 18-29 | 16 | 5 | 31.25% | 11 | 68.75% |
| 30-39 | 21 | 4 | 19.05% | 17 | 80.95% |
| 40-49 | 34 | 12 | 35.29% | 22 | 64.71% |
| 50-59 | 31 | 7 | 22.58% | 24 | 77.42% |
| 60-69 | 6 | 0 | 0.00% | 6 | 100.00% |
| 70+ | 1 | 0 | 0.00% | 1 | 100.00% |
The youngest and oldest candidate submitted
| Age | Institution | |
|---|---|---|
| Youngest | 22 | Rada Miejska Inowrocławia |
| Oldest | 73 | Rada Miejska Inowrocławia |