Komitet Wyborczy Wyborców Nasza Gmina Nasz Powiat
| Name: | Komitet Wyborczy Wyborców Nasza Gmina Nasz Powiat | |
| Short name: | KWW Nasza Gmina Nasz Powiat | |
| Type of committee: | Election committees established by electors | |
| Address: | ul.Gospodarcza 44, 27-300 Lipsko | |
| Plenipotentiary: | electoral | financial |
| Tadeusz Wacław Kosiński | Jan Józef Rabiniak | |
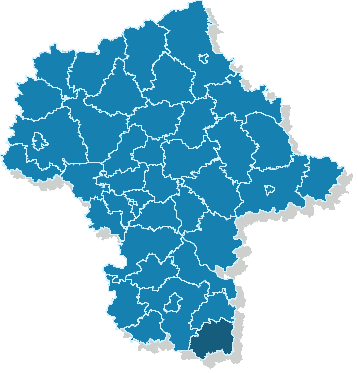
The provinces where the committee has submitted lists of candidates
| Name |
|---|
| pow. lipski |
The statistics of election committe
Lists submitted
| Description | Number of |
|---|---|
| Number of lists submitted for province council | 0 |
| Number of lists submitted for county councils | 4 |
| Number of lists submitted for councils of cities holding county rights | 0 |
| Number of lists submitted for districts councils of the cap. city of Warsaw | 0 |
| Number of lists registered for communal councils | 37 |
| Totalling | 41 |
Submitted candidates
| Name | Number of candidates | Women | Women (%) | Men | Men (%) |
|---|---|---|---|---|---|
| Number of candidates submitted for the province council | 0 | 0 | - | 0 | - |
| Number of candidates submitted for county councils | 28 | 10 | 35.71% | 18 | 64.29% |
| Number of candidates submitted for councils of cities holding county rights | 0 | 0 | - | 0 | - |
| Number of candidates submitted for districts councils of the cap. city of Warsaw | 0 | 0 | - | 0 | - |
| Number of candidates registered for communal councils | 45 | 14 | 31.11% | 31 | 68.89% |
| Number of candidates submitted for reeve, mayor and presidential elections | 3 | 1 | 33.33% | 2 | 66.67% |
| Totalling | 76 | 25 | 32.89% | 51 | 67.11% |
Average age of submitted candidates
| Name | Average age | Average age of women | Average age of men |
|---|---|---|---|
| Average age of candidates submitted for the province council | - | - | - |
| Average age of candidates submitted for county councils | 43 | 46 | 41 |
| Average age of candidates for councils of cities holding county rights | - | - | - |
| Average age of candidates for districts councils of the cap. city of Warsaw | - | - | - |
| Average age of candidates submitted for communal councils | 42 | 41 | 42 |
| Average age of candidates for reeve, mayor, president | 44 | 58 | 38 |
| Totalling | 42 | 44 | 42 |
Submitted candidates grouped by age
| Name | Number of candidates | Women | Women (%) | Men | Men (%) |
|---|---|---|---|---|---|
| 18-29 | 9 | 2 | 22.22% | 7 | 77.78% |
| 30-39 | 15 | 7 | 46.67% | 8 | 53.33% |
| 40-49 | 33 | 8 | 24.24% | 25 | 75.76% |
| 50-59 | 17 | 7 | 41.18% | 10 | 58.82% |
| 60-69 | 2 | 1 | 50.00% | 1 | 50.00% |
| 70+ | 0 | 0 | — | 0 | — |
The youngest and oldest candidate submitted
| Age | Institution | |
|---|---|---|
| Youngest | 20 | Rada Powiatu Lipskiego |
| Oldest | 62 | Rada Powiatu Lipskiego |