Komitet Wyborczy Wyborców "Samorządna Opolszczyzna"
| Name: | Komitet Wyborczy Wyborców "Samorządna Opolszczyzna" | |
| Short name: | KWW "Samorządna Opolszczyzna" | |
| Type of committee: | Election committees established by electors | |
| Address: | ul. Szpitalna 17a, 45-010 Opole | |
| Plenipotentiary: | electoral | financial |
| Antoni Klusik | Paweł Jerzy Nakonieczny | |
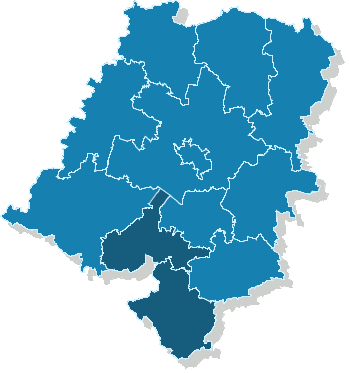
The provinces where the committee has submitted lists of candidates
| Name |
|---|
| pow. głubczycki |
| pow. prudnicki |
Sejmik Województwa Opolskiego
Submitted candidates
| Name | Number of candidates | Women | Women (%) | Men | Men (%) | Status |
|---|---|---|---|---|---|---|
| Sum: | 16 | 7 | 43.75% | 9 | 56.25% | |
| Constituency no. 1 | 5 | 2 | 40.00% | 3 | 60.00% |
|
| Constituency no. 2 | 5 | 2 | 40.00% | 3 | 60.00% |
|
| Constituency no. 5 | 6 | 3 | 50.00% | 3 | 50.00% |
|
Age of the candidates
| Name | Average age | Average age of women | Average age of men | Oldest | Youngest |
|---|---|---|---|---|---|
| Constituency no. 1 | 43 | 38 | 47 | 59 | 28 |
| Constituency no. 2 | 39 | 44 | 36 | 54 | 25 |
| Constituency no. 5 | 48 | 44 | 53 | 68 | 29 |
The statistics of election committe
Lists submitted
| Description | Number of |
|---|---|
| Number of lists submitted for province council | 3 |
| Number of lists submitted for county councils | 2 |
| Number of lists submitted for councils of cities holding county rights | 0 |
| Number of lists submitted for districts councils of the cap. city of Warsaw | 0 |
| Number of lists registered for communal councils | 8 |
| Totalling | 13 |
Submitted candidates
| Name | Number of candidates | Women | Women (%) | Men | Men (%) |
|---|---|---|---|---|---|
| Number of candidates submitted for the province council | 16 | 7 | 43.75% | 9 | 56.25% |
| Number of candidates submitted for county councils | 15 | 6 | 40.00% | 9 | 60.00% |
| Number of candidates submitted for councils of cities holding county rights | 0 | 0 | - | 0 | - |
| Number of candidates submitted for districts councils of the cap. city of Warsaw | 0 | 0 | - | 0 | - |
| Number of candidates registered for communal councils | 21 | 10 | 47.62% | 11 | 52.38% |
| Number of candidates submitted for reeve, mayor and presidential elections | 2 | 0 | 0.00% | 2 | 100.00% |
| Totalling | 54 | 23 | 42.59% | 31 | 57.41% |
Average age of submitted candidates
| Name | Average age | Average age of women | Average age of men |
|---|---|---|---|
| Average age of candidates submitted for the province council | 44 | 42 | 45 |
| Average age of candidates submitted for county councils | 48 | 48 | 48 |
| Average age of candidates for councils of cities holding county rights | - | - | - |
| Average age of candidates for districts councils of the cap. city of Warsaw | - | - | - |
| Average age of candidates submitted for communal councils | 44 | 50 | 38 |
| Average age of candidates for reeve, mayor, president | 50 | - | 50 |
| Totalling | 45 | 47 | 44 |
Submitted candidates grouped by age
| Name | Number of candidates | Women | Women (%) | Men | Men (%) |
|---|---|---|---|---|---|
| 18-29 | 10 | 2 | 20.00% | 8 | 80.00% |
| 30-39 | 7 | 4 | 57.14% | 3 | 42.86% |
| 40-49 | 10 | 3 | 30.00% | 7 | 70.00% |
| 50-59 | 23 | 13 | 56.52% | 10 | 43.48% |
| 60-69 | 3 | 0 | 0.00% | 3 | 100.00% |
| 70+ | 1 | 1 | 100.00% | 0 | 0.00% |
The youngest and oldest candidate submitted
| Age | Institution | |
|---|---|---|
| Youngest | 20 | Rada Powiatu w Głubczycach |
| Oldest | 71 | Rada Miejska w Głubczycach |