Komitet Wyborczy FORUM SAMORZĄDOWE ZIEMI PLESZEWSKIEJ
| Name: | Komitet Wyborczy FORUM SAMORZĄDOWE ZIEMI PLESZEWSKIEJ | |
| Short name: | KW FORUM SAMORZĄDOWE ZIEMI PLESZEWSKIEJ | |
| Type of committee: | Election committees established by organisations | |
| Address: | ul. Szpitalna 17, 63-300 Pleszew | |
| Plenipotentiary: | electoral | financial |
| Piotr Marian Hasiński | Anna Nawrocka | |
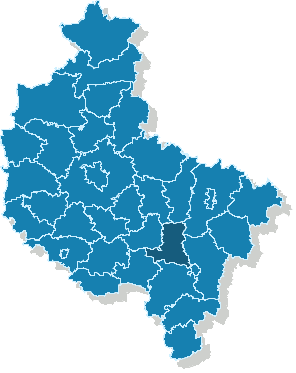
The provinces where the committee has submitted lists of candidates
| Name |
|---|
| pow. pleszewski |
The statistics of election committe
Lists submitted
| Description | Number of |
|---|---|
| Number of lists submitted for province council | 0 |
| Number of lists submitted for county councils | 4 |
| Number of lists submitted for councils of cities holding county rights | 0 |
| Number of lists submitted for districts councils of the cap. city of Warsaw | 0 |
| Number of lists registered for communal councils | 8 |
| Totalling | 12 |
Submitted candidates
| Name | Number of candidates | Women | Women (%) | Men | Men (%) |
|---|---|---|---|---|---|
| Number of candidates submitted for the province council | 0 | 0 | - | 0 | - |
| Number of candidates submitted for county councils | 38 | 5 | 13.16% | 33 | 86.84% |
| Number of candidates submitted for councils of cities holding county rights | 0 | 0 | - | 0 | - |
| Number of candidates submitted for districts councils of the cap. city of Warsaw | 0 | 0 | - | 0 | - |
| Number of candidates registered for communal councils | 28 | 10 | 35.71% | 18 | 64.29% |
| Number of candidates submitted for reeve, mayor and presidential elections | 0 | 0 | - | 0 | - |
| Totalling | 66 | 15 | 22.73% | 51 | 77.27% |
Average age of submitted candidates
| Name | Average age | Average age of women | Average age of men |
|---|---|---|---|
| Average age of candidates submitted for the province council | - | - | - |
| Average age of candidates submitted for county councils | 50 | 56 | 50 |
| Average age of candidates for councils of cities holding county rights | - | - | - |
| Average age of candidates for districts councils of the cap. city of Warsaw | - | - | - |
| Average age of candidates submitted for communal councils | 50 | 51 | 50 |
| Average age of candidates for reeve, mayor, president | - | - | - |
| Totalling | 50 | 52 | 50 |
Submitted candidates grouped by age
| Name | Number of candidates | Women | Women (%) | Men | Men (%) |
|---|---|---|---|---|---|
| 18-29 | 3 | 0 | 0.00% | 3 | 100.00% |
| 30-39 | 8 | 1 | 12.50% | 7 | 87.50% |
| 40-49 | 16 | 5 | 31.25% | 11 | 68.75% |
| 50-59 | 30 | 7 | 23.33% | 23 | 76.67% |
| 60-69 | 6 | 0 | 0.00% | 6 | 100.00% |
| 70+ | 3 | 2 | 66.67% | 1 | 33.33% |
The youngest and oldest candidate submitted
| Age | Institution | |
|---|---|---|
| Youngest | 28 | Rada Miejska w Pleszewie |
| Oldest | 72 | Rada Powiatu w Pleszewie |