Komitet Wyborczy Stowarzyszenia Sołtysów Powiatu Sejneńskiego
| Name: | Komitet Wyborczy Stowarzyszenia Sołtysów Powiatu Sejneńskiego | |
| Short name: | Komitet Wyborczy Stowarzyszenia Sołtysów | |
| Type of committee: | Election committees established by organisations | |
| Address: | ul. Piłsudskiego 34; 16-500 Sejny | |
| Plenipotentiary: | electoral | financial |
| Piotr Marian Luto | Honorata Szyryńska Jarzębowicz | |
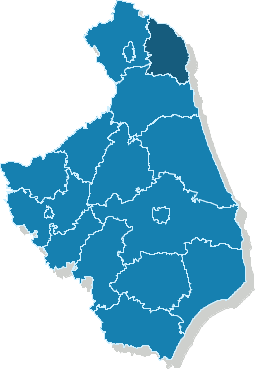
The provinces where the committee has submitted lists of candidates
| Name |
|---|
| pow. sejneński |
The statistics of election committe
Lists submitted
| Description | Number of |
|---|---|
| Number of lists submitted for province council | 0 |
| Number of lists submitted for county councils | 4 |
| Number of lists submitted for councils of cities holding county rights | 0 |
| Number of lists submitted for districts councils of the cap. city of Warsaw | 0 |
| Number of lists registered for communal councils | 22 |
| Totalling | 26 |
Submitted candidates
| Name | Number of candidates | Women | Women (%) | Men | Men (%) |
|---|---|---|---|---|---|
| Number of candidates submitted for the province council | 0 | 0 | - | 0 | - |
| Number of candidates submitted for county councils | 29 | 6 | 20.69% | 23 | 79.31% |
| Number of candidates submitted for councils of cities holding county rights | 0 | 0 | - | 0 | - |
| Number of candidates submitted for districts councils of the cap. city of Warsaw | 0 | 0 | - | 0 | - |
| Number of candidates registered for communal councils | 30 | 4 | 13.33% | 26 | 86.67% |
| Number of candidates submitted for reeve, mayor and presidential elections | 2 | 0 | 0.00% | 2 | 100.00% |
| Totalling | 61 | 10 | 16.39% | 51 | 83.61% |
Average age of submitted candidates
| Name | Average age | Average age of women | Average age of men |
|---|---|---|---|
| Average age of candidates submitted for the province council | - | - | - |
| Average age of candidates submitted for county councils | 49 | 47 | 49 |
| Average age of candidates for councils of cities holding county rights | - | - | - |
| Average age of candidates for districts councils of the cap. city of Warsaw | - | - | - |
| Average age of candidates submitted for communal councils | 45 | 44 | 45 |
| Average age of candidates for reeve, mayor, president | 53 | - | 53 |
| Totalling | 47 | 46 | 47 |
Submitted candidates grouped by age
| Name | Number of candidates | Women | Women (%) | Men | Men (%) |
|---|---|---|---|---|---|
| 18-29 | 2 | 0 | 0.00% | 2 | 100.00% |
| 30-39 | 11 | 3 | 27.27% | 8 | 72.73% |
| 40-49 | 22 | 4 | 18.18% | 18 | 81.82% |
| 50-59 | 20 | 2 | 10.00% | 18 | 90.00% |
| 60-69 | 6 | 1 | 16.67% | 5 | 83.33% |
| 70+ | 0 | 0 | — | 0 | — |
The youngest and oldest candidate submitted
| Age | Institution | |
|---|---|---|
| Youngest | 27 | Rada Gminy Krasnopol |
| Oldest | 65 | Rada Powiatu Sejneńskiego |