Komitet Wyborczy Wyborców Jedność i Rozwój
| Name: | Komitet Wyborczy Wyborców Jedność i Rozwój | |
| Short name: | KWW Jedność i Rozwój | |
| Type of committee: | Election committees established by electors | |
| Address: | Plac 3 Maja 23 22-300 Krasnystaw | |
| Plenipotentiary: | electoral | financial |
| Zbigniew Jankowski | Jan Wójcik | |
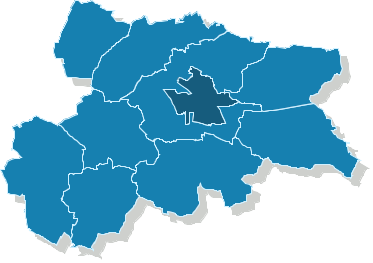
The counties and cities holding county rights where the committee has submitted lists of candidates
| Name |
|---|
| m. Krasnystaw |
Rada Powiatu w Krasnymstawie
Submitted candidates
| Name | Number of candidates | Women | Women (%) | Men | Men (%) | Status |
|---|---|---|---|---|---|---|
| Sum: | 37 | 11 | 29.73% | 26 | 70.27% | |
| Constituency no. 1 | 10 | 3 | 30.00% | 7 | 70.00% |
|
| Constituency no. 2 | 10 | 4 | 40.00% | 6 | 60.00% |
|
| Constituency no. 3 | 9 | 2 | 22.22% | 7 | 77.78% |
|
| Constituency no. 4 | 8 | 2 | 25.00% | 6 | 75.00% |
|
Age of the candidates
| Name | Average age | Average age of women | Average age of men | Oldest | Youngest |
|---|---|---|---|---|---|
| Constituency no. 1 | 44 | 45 | 44 | 64 | 33 |
| Constituency no. 2 | 47 | 48 | 47 | 62 | 31 |
| Constituency no. 3 | 46 | 41 | 47 | 55 | 26 |
| Constituency no. 4 | 43 | 34 | 46 | 60 | 28 |
The statistics of election committe
Lists submitted
| Description | Number of |
|---|---|
| Number of lists submitted for county councils | 4 |
| Number of lists submitted for councils of cities holding county rights | 0 |
| Number of lists registered for communal councils | 4 |
| Totalling | 8 |
Submitted candidates
| Name | Number of candidates | Women | Women (%) | Men | Men (%) |
|---|---|---|---|---|---|
| Number of candidates submitted for county councils | 37 | 11 | 29.73% | 26 | 70.27% |
| Number of candidates submitted for councils of cities holding county rights | 0 | 0 | - | 0 | - |
| Number of candidates registered for communal councils | 39 | 15 | 38.46% | 24 | 61.54% |
| Number of candidates submitted for reeve, mayor and presidential elections | 0 | 0 | - | 0 | - |
| Totalling | 76 | 26 | 34.21% | 50 | 65.79% |
Average age of submitted candidates
| Name | Average age | Average age of women | Average age of men |
|---|---|---|---|
| Average age of candidates submitted for county councils | 45 | 43 | 46 |
| Average age of candidates for councils of cities holding county rights | - | - | - |
| Average age of candidates submitted for communal councils | 41 | 40 | 42 |
| Average age of candidates for reeve, mayor, president | - | - | - |
| Totalling | 43 | 41 | 44 |
Submitted candidates grouped by age
| Name | Number of candidates | Women | Women (%) | Men | Men (%) |
|---|---|---|---|---|---|
| 18-29 | 8 | 3 | 37.50% | 5 | 62.50% |
| 30-39 | 22 | 11 | 50.00% | 11 | 50.00% |
| 40-49 | 21 | 5 | 23.81% | 16 | 76.19% |
| 50-59 | 19 | 4 | 21.05% | 15 | 78.95% |
| 60-69 | 6 | 3 | 50.00% | 3 | 50.00% |
| 70+ | 0 | 0 | — | 0 | — |
The youngest and oldest candidate submitted
| Age | Institution | |
|---|---|---|
| Youngest | 24 | Rada Miasta Krasnystaw |
| Oldest | 64 | Rada Miasta Krasnystaw |