Komitet Wyborczy Stowarzyszenie "Porozumienie Samorządowe"
| Name: | Komitet Wyborczy Stowarzyszenie "Porozumienie Samorządowe" | |
| Short name: | KW Porozumienie Samorządowe | |
| Type of committee: | Election committees established by organisations | |
| Address: | ul. Śródmiejska 16, 64-920 Piła | |
| Plenipotentiary: | electoral | financial |
| Marek Andrzej Światopełk-Mirski | Krystyna Kicińska | |
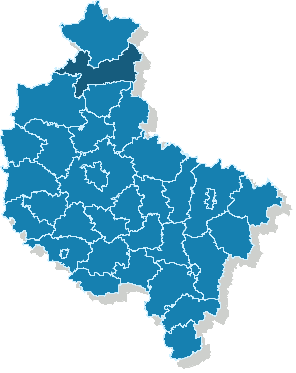
The provinces where the committee has submitted lists of candidates
| Name |
|---|
| pow. pilski |
The statistics of election committe
Lists submitted
| Description | Number of |
|---|---|
| Number of lists submitted for province council | 0 |
| Number of lists submitted for county councils | 7 |
| Number of lists submitted for councils of cities holding county rights | 0 |
| Number of lists submitted for districts councils of the cap. city of Warsaw | 0 |
| Number of lists registered for communal councils | 4 |
| Totalling | 11 |
Submitted candidates
| Name | Number of candidates | Women | Women (%) | Men | Men (%) |
|---|---|---|---|---|---|
| Number of candidates submitted for the province council | 0 | 0 | - | 0 | - |
| Number of candidates submitted for county councils | 50 | 17 | 34.00% | 33 | 66.00% |
| Number of candidates submitted for councils of cities holding county rights | 0 | 0 | - | 0 | - |
| Number of candidates submitted for districts councils of the cap. city of Warsaw | 0 | 0 | - | 0 | - |
| Number of candidates registered for communal councils | 46 | 11 | 23.91% | 35 | 76.09% |
| Number of candidates submitted for reeve, mayor and presidential elections | 1 | 0 | 0.00% | 1 | 100.00% |
| Totalling | 97 | 28 | 28.87% | 69 | 71.13% |
Average age of submitted candidates
| Name | Average age | Average age of women | Average age of men |
|---|---|---|---|
| Average age of candidates submitted for the province council | - | - | - |
| Average age of candidates submitted for county councils | 47 | 44 | 49 |
| Average age of candidates for councils of cities holding county rights | - | - | - |
| Average age of candidates for districts councils of the cap. city of Warsaw | - | - | - |
| Average age of candidates submitted for communal councils | 47 | 46 | 47 |
| Average age of candidates for reeve, mayor, president | 43 | - | 43 |
| Totalling | 47 | 45 | 48 |
Submitted candidates grouped by age
| Name | Number of candidates | Women | Women (%) | Men | Men (%) |
|---|---|---|---|---|---|
| 18-29 | 10 | 3 | 30.00% | 7 | 70.00% |
| 30-39 | 12 | 3 | 25.00% | 9 | 75.00% |
| 40-49 | 28 | 10 | 35.71% | 18 | 64.29% |
| 50-59 | 30 | 10 | 33.33% | 20 | 66.67% |
| 60-69 | 17 | 2 | 11.76% | 15 | 88.24% |
| 70+ | 0 | 0 | — | 0 | — |
The youngest and oldest candidate submitted
| Age | Institution | |
|---|---|---|
| Youngest | 21 | Rada Miasta Piły |
| Oldest | 69 | Rada Miasta Piły |