Komitet Wyborczy Wyborców "FORUM SPOŁECZNO-GOSPODARCZE"
| Name: | Komitet Wyborczy Wyborców "FORUM SPOŁECZNO-GOSPODARCZE" | |
| Short name: | KWW "FORUM SPOŁECZNO-GOSPODARCZE" | |
| Type of committee: | Election committees established by electors | |
| Address: | ul. Kościuszki 9, 63-600 Kępno | |
| Plenipotentiary: | electoral | financial |
| Jarosław Marian Marciniak | Jan Franciszek Trojak | |
The provinces where the committee has submitted lists of candidates
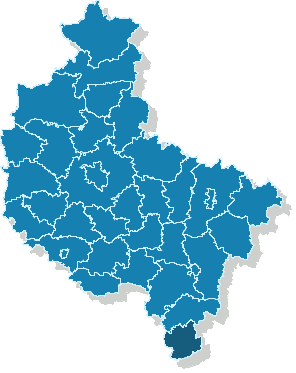
| Name |
|---|
| pow. kępiński |
The statistics of election committe
Lists submitted
| Description | Number of |
|---|---|
| Number of lists submitted for province council | 0 |
| Number of lists submitted for county councils | 3 |
| Number of lists submitted for councils of cities holding county rights | 0 |
| Number of lists submitted for districts councils of the cap. city of Warsaw | 0 |
| Number of lists registered for communal councils | 20 |
| Totalling | 23 |
Submitted candidates
| Name | Number of candidates | Women | Women (%) | Men | Men (%) |
|---|---|---|---|---|---|
| Number of candidates submitted for the province council | 0 | 0 | - | 0 | - |
| Number of candidates submitted for county councils | 32 | 12 | 37.50% | 20 | 62.50% |
| Number of candidates submitted for councils of cities holding county rights | 0 | 0 | - | 0 | - |
| Number of candidates submitted for districts councils of the cap. city of Warsaw | 0 | 0 | - | 0 | - |
| Number of candidates registered for communal councils | 55 | 16 | 29.09% | 39 | 70.91% |
| Number of candidates submitted for reeve, mayor and presidential elections | 3 | 0 | 0.00% | 3 | 100.00% |
| Totalling | 90 | 28 | 31.11% | 62 | 68.89% |
Average age of submitted candidates
| Name | Average age | Average age of women | Average age of men |
|---|---|---|---|
| Average age of candidates submitted for the province council | - | - | - |
| Average age of candidates submitted for county councils | 52 | 52 | 53 |
| Average age of candidates for councils of cities holding county rights | - | - | - |
| Average age of candidates for districts councils of the cap. city of Warsaw | - | - | - |
| Average age of candidates submitted for communal councils | 47 | 48 | 46 |
| Average age of candidates for reeve, mayor, president | 55 | - | 55 |
| Totalling | 49 | 50 | 49 |
Submitted candidates grouped by age
| Name | Number of candidates | Women | Women (%) | Men | Men (%) |
|---|---|---|---|---|---|
| 18-29 | 7 | 2 | 28.57% | 5 | 71.43% |
| 30-39 | 10 | 1 | 10.00% | 9 | 90.00% |
| 40-49 | 23 | 7 | 30.43% | 16 | 69.57% |
| 50-59 | 39 | 15 | 38.46% | 24 | 61.54% |
| 60-69 | 11 | 3 | 27.27% | 8 | 72.73% |
| 70+ | 0 | 0 | — | 0 | — |
The youngest and oldest candidate submitted
| Age | Institution | |
|---|---|---|
| Youngest | 25 | Rada Gminy Łęka Opatowska |
| Oldest | 69 | Rada Gminy Bralin |