Komitet Wyborczy Wyborców "Nasza gmina, nasz powiat - to my"
| Name: | Komitet Wyborczy Wyborców "Nasza gmina, nasz powiat - to my" | |
| Short name: | KWW "Nasza gmina, nasz powiat - to my" | |
| Type of committee: | Election committees established by electors | |
| Address: | ul. Jeziorna 4/2, 78-500 Drawsko Pomorskie | |
| Plenipotentiary: | electoral | financial |
| Elżbieta Małgorzata Koba | Jolanta Pluto - Prądzyńska | |
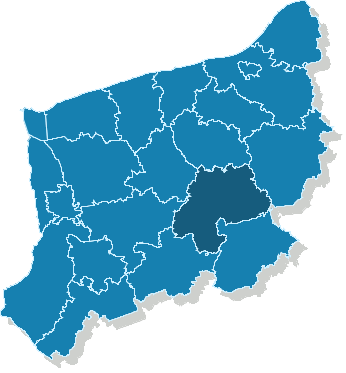
The provinces where the committee has submitted lists of candidates
| Name |
|---|
| pow. drawski |
The statistics of election committe
Lists submitted
| Description | Number of |
|---|---|
| Number of lists submitted for province council | 0 |
| Number of lists submitted for county councils | 1 |
| Number of lists submitted for councils of cities holding county rights | 0 |
| Number of lists submitted for districts councils of the cap. city of Warsaw | 0 |
| Number of lists registered for communal councils | 7 |
| Totalling | 8 |
Submitted candidates
| Name | Number of candidates | Women | Women (%) | Men | Men (%) |
|---|---|---|---|---|---|
| Number of candidates submitted for the province council | 0 | 0 | - | 0 | - |
| Number of candidates submitted for county councils | 16 | 7 | 43.75% | 9 | 56.25% |
| Number of candidates submitted for councils of cities holding county rights | 0 | 0 | - | 0 | - |
| Number of candidates submitted for districts councils of the cap. city of Warsaw | 0 | 0 | - | 0 | - |
| Number of candidates registered for communal councils | 15 | 5 | 33.33% | 10 | 66.67% |
| Number of candidates submitted for reeve, mayor and presidential elections | 1 | 0 | 0.00% | 1 | 100.00% |
| Totalling | 32 | 12 | 37.50% | 20 | 62.50% |
Average age of submitted candidates
| Name | Average age | Average age of women | Average age of men |
|---|---|---|---|
| Average age of candidates submitted for the province council | - | - | - |
| Average age of candidates submitted for county councils | 48 | 47 | 50 |
| Average age of candidates for councils of cities holding county rights | - | - | - |
| Average age of candidates for districts councils of the cap. city of Warsaw | - | - | - |
| Average age of candidates submitted for communal councils | 49 | 56 | 46 |
| Average age of candidates for reeve, mayor, president | 51 | - | 51 |
| Totalling | 49 | 51 | 48 |
Submitted candidates grouped by age
| Name | Number of candidates | Women | Women (%) | Men | Men (%) |
|---|---|---|---|---|---|
| 18-29 | 1 | 0 | 0.00% | 1 | 100.00% |
| 30-39 | 5 | 2 | 40.00% | 3 | 60.00% |
| 40-49 | 9 | 3 | 33.33% | 6 | 66.67% |
| 50-59 | 12 | 4 | 33.33% | 8 | 66.67% |
| 60-69 | 5 | 3 | 60.00% | 2 | 40.00% |
| 70+ | 0 | 0 | — | 0 | — |
The youngest and oldest candidate submitted
| Age | Institution | |
|---|---|---|
| Youngest | 29 | Rada Miejska w Drawsku Pomorskim |
| Oldest | 64 | Rada Miejska w Drawsku Pomorskim |