Komitet Wyborczy Wyborców Mieszkańców Ziemi Głubczyckiej
| Name: | Komitet Wyborczy Wyborców Mieszkańców Ziemi Głubczyckiej | |
| Short name: | KWW Mieszkańców Ziemi Głubczyckiej | |
| Type of committee: | Election committees established by electors | |
| Address: | 48-100 Głubczyce, ul. Kościuszki 11 | |
| Plenipotentiary: | electoral | financial |
| Jan Hilary Bażyński | Aleksander Tomasz Bachus | |
The provinces where the committee has submitted lists of candidates
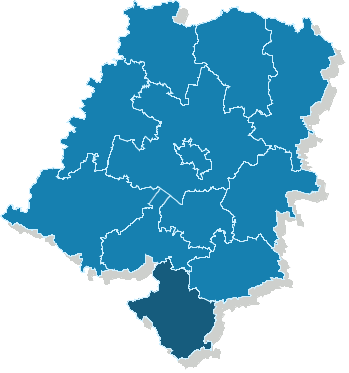
| Name |
|---|
| pow. głubczycki |
The statistics of election committe
Lists submitted
| Description | Number of |
|---|---|
| Number of lists submitted for province council | 0 |
| Number of lists submitted for county councils | 3 |
| Number of lists submitted for councils of cities holding county rights | 0 |
| Number of lists submitted for districts councils of the cap. city of Warsaw | 0 |
| Number of lists registered for communal councils | 16 |
| Totalling | 19 |
Submitted candidates
| Name | Number of candidates | Women | Women (%) | Men | Men (%) |
|---|---|---|---|---|---|
| Number of candidates submitted for the province council | 0 | 0 | - | 0 | - |
| Number of candidates submitted for county councils | 29 | 5 | 17.24% | 24 | 82.76% |
| Number of candidates submitted for councils of cities holding county rights | 0 | 0 | - | 0 | - |
| Number of candidates submitted for districts councils of the cap. city of Warsaw | 0 | 0 | - | 0 | - |
| Number of candidates registered for communal councils | 59 | 9 | 15.25% | 50 | 84.75% |
| Number of candidates submitted for reeve, mayor and presidential elections | 0 | 0 | - | 0 | - |
| Totalling | 88 | 14 | 15.91% | 74 | 84.09% |
Average age of submitted candidates
| Name | Average age | Average age of women | Average age of men |
|---|---|---|---|
| Average age of candidates submitted for the province council | - | - | - |
| Average age of candidates submitted for county councils | 53 | 52 | 53 |
| Average age of candidates for councils of cities holding county rights | - | - | - |
| Average age of candidates for districts councils of the cap. city of Warsaw | - | - | - |
| Average age of candidates submitted for communal councils | 49 | 50 | 49 |
| Average age of candidates for reeve, mayor, president | - | - | - |
| Totalling | 50 | 51 | 50 |
Submitted candidates grouped by age
| Name | Number of candidates | Women | Women (%) | Men | Men (%) |
|---|---|---|---|---|---|
| 18-29 | 6 | 0 | 0.00% | 6 | 100.00% |
| 30-39 | 10 | 2 | 20.00% | 8 | 80.00% |
| 40-49 | 16 | 4 | 25.00% | 12 | 75.00% |
| 50-59 | 38 | 6 | 15.79% | 32 | 84.21% |
| 60-69 | 16 | 2 | 12.50% | 14 | 87.50% |
| 70+ | 2 | 0 | 0.00% | 2 | 100.00% |
The youngest and oldest candidate submitted
| Age | Institution | |
|---|---|---|
| Youngest | 20 | Rada Gminy Branice |
| Oldest | 75 | Rada Powiatu w Głubczycach |