Komitet Wyborczy Chrześcijańskiego Ruchu Samorządowego
| Name: | Komitet Wyborczy Chrześcijańskiego Ruchu Samorządowego | |
| Short name: | KW Chrześcijańskiego Ruchu Samorządowego | |
| Type of committee: | Election committees established by organisations | |
| Address: | ul. Piotrkowska 133, 90-434 Łódź | |
| Plenipotentiary: | electoral | financial |
| Grzegorz Kaźmierczak | Grażyna Korasiewicz | |
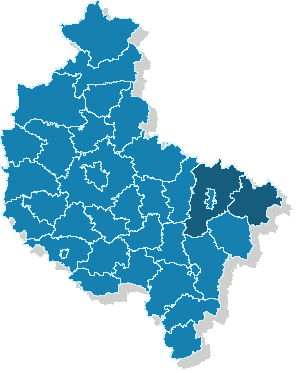
The provinces where the committee has submitted lists of candidates
| Name |
|---|
| pow. kolski |
| pow. koniński |
Sejmik Województwa Wielkopolskiego
Submitted candidates
| Name | Number of candidates | Women | Women (%) | Men | Men (%) | Status |
|---|---|---|---|---|---|---|
| Sum: | 5 | 1 | 20.00% | 4 | 80.00% | |
| Constituency no. 4 | 5 | 1 | 20.00% | 4 | 80.00% |
|
Age of the candidates
| Name | Average age | Average age of women | Average age of men | Oldest | Youngest |
|---|---|---|---|---|---|
| Constituency no. 4 | 46 | 29 | 51 | 58 | 29 |
The statistics of election committe
Lists submitted
| Description | Number of |
|---|---|
| Number of lists submitted for province council | 1 |
| Number of lists submitted for county councils | 6 |
| Number of lists submitted for councils of cities holding county rights | 0 |
| Number of lists registered for communal councils | 3 |
| Totalling | 10 |
Submitted candidates
| Name | Number of candidates | Women | Women (%) | Men | Men (%) |
|---|---|---|---|---|---|
| Number of candidates submitted for the province council | 5 | 1 | 20.00% | 4 | 80.00% |
| Number of candidates submitted for county councils | 26 | 9 | 34.62% | 17 | 65.38% |
| Number of candidates submitted for councils of cities holding county rights | 0 | 0 | - | 0 | - |
| Number of candidates registered for communal councils | 3 | 1 | 33.33% | 2 | 66.67% |
| Number of candidates submitted for reeve, mayor and presidential elections | 0 | 0 | - | 0 | - |
| Totalling | 34 | 11 | 32.35% | 23 | 67.65% |
Average age of submitted candidates
| Name | Average age | Average age of women | Average age of men |
|---|---|---|---|
| Average age of candidates submitted for the province council | 46 | 29 | 51 |
| Average age of candidates submitted for county councils | 39 | 38 | 39 |
| Average age of candidates for councils of cities holding county rights | - | - | - |
| Average age of candidates submitted for communal councils | 45 | 68 | 34 |
| Average age of candidates for reeve, mayor, president | - | - | - |
| Totalling | 40 | 40 | 41 |
Submitted candidates grouped by age
| Name | Number of candidates | Women | Women (%) | Men | Men (%) |
|---|---|---|---|---|---|
| 18-29 | 10 | 5 | 50.00% | 5 | 50.00% |
| 30-39 | 6 | 0 | 0.00% | 6 | 100.00% |
| 40-49 | 8 | 3 | 37.50% | 5 | 62.50% |
| 50-59 | 8 | 1 | 12.50% | 7 | 87.50% |
| 60-69 | 2 | 2 | 100.00% | 0 | 0.00% |
| 70+ | 0 | 0 | — | 0 | — |
The youngest and oldest candidate submitted
| Age | Institution | |
|---|---|---|
| Youngest | 21 | Rada Powiatu Konińskiego |
| Oldest | 68 | Rada Gminy Grzegorzew |