Komitet Wyborczy Wyborców Odsiecz Samorządom
| Name: | Komitet Wyborczy Wyborców Odsiecz Samorządom | |
| Short name: | KWW Odsiecz Samorządom | |
| Type of committee: | Election committees established by electors | |
| Address: | Mrowiska 1, 05-074 Halinów | |
| Plenipotentiary: | electoral | financial |
| Włodzimierz Ryszard Kostka | Wiesław Dariusz Szulim | |
The provinces where the committee has submitted lists of candidates
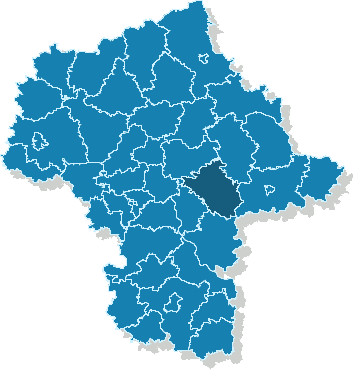
| Name |
|---|
| pow. miński |
The statistics of election committe
Lists submitted
| Description | Number of |
|---|---|
| Number of lists submitted for province council | 0 |
| Number of lists submitted for county councils | 5 |
| Number of lists submitted for councils of cities holding county rights | 0 |
| Number of lists submitted for districts councils of the cap. city of Warsaw | 0 |
| Number of lists registered for communal councils | 11 |
| Totalling | 16 |
Submitted candidates
| Name | Number of candidates | Women | Women (%) | Men | Men (%) |
|---|---|---|---|---|---|
| Number of candidates submitted for the province council | 0 | 0 | - | 0 | - |
| Number of candidates submitted for county councils | 23 | 7 | 30.43% | 16 | 69.57% |
| Number of candidates submitted for councils of cities holding county rights | 0 | 0 | - | 0 | - |
| Number of candidates submitted for districts councils of the cap. city of Warsaw | 0 | 0 | - | 0 | - |
| Number of candidates registered for communal councils | 12 | 7 | 58.33% | 5 | 41.67% |
| Number of candidates submitted for reeve, mayor and presidential elections | 1 | 0 | 0.00% | 1 | 100.00% |
| Totalling | 36 | 14 | 38.89% | 22 | 61.11% |
Average age of submitted candidates
| Name | Average age | Average age of women | Average age of men |
|---|---|---|---|
| Average age of candidates submitted for the province council | - | - | - |
| Average age of candidates submitted for county councils | 42 | 38 | 44 |
| Average age of candidates for councils of cities holding county rights | - | - | - |
| Average age of candidates for districts councils of the cap. city of Warsaw | - | - | - |
| Average age of candidates submitted for communal councils | 47 | 42 | 54 |
| Average age of candidates for reeve, mayor, president | 55 | - | 55 |
| Totalling | 44 | 40 | 46 |
Submitted candidates grouped by age
| Name | Number of candidates | Women | Women (%) | Men | Men (%) |
|---|---|---|---|---|---|
| 18-29 | 3 | 2 | 66.67% | 1 | 33.33% |
| 30-39 | 11 | 4 | 36.36% | 7 | 63.64% |
| 40-49 | 7 | 3 | 42.86% | 4 | 57.14% |
| 50-59 | 11 | 5 | 45.45% | 6 | 54.55% |
| 60-69 | 3 | 0 | 0.00% | 3 | 100.00% |
| 70+ | 1 | 0 | 0.00% | 1 | 100.00% |
The youngest and oldest candidate submitted
| Age | Institution | |
|---|---|---|
| Youngest | 21 | Rada Gminy w Siennicy |
| Oldest | 70 | Rada Powiatu Mińskiego |