Komitet Wyborczy Wyborców Haliny Kurtyki z ziemi zabierzowskiej
| Name: | Komitet Wyborczy Wyborców Haliny Kurtyki z ziemi zabierzowskiej | |
| Short name: | KWW Haliny Kurtyki Ziemi Zabierzowskiej | |
| Type of committee: | Election committees established by electors | |
| Address: | ul. Poziomkowa 26, 32-080 Zabierzów | |
| Plenipotentiary: | electoral | financial |
| Zbigniew Dobrzański | Kazimierz Dolny | |
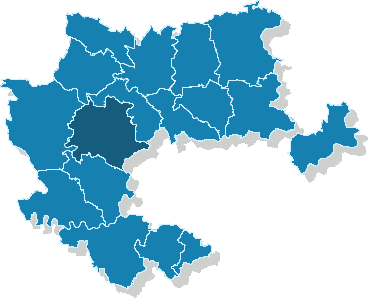
The counties and cities holding county rights where the committee has submitted lists of candidates
| Name |
|---|
| gm. Zabierzów |
The statistics of election committe
Lists submitted
| Description | Number of |
|---|---|
| Number of lists submitted for county councils | 0 |
| Number of lists submitted for councils of cities holding county rights | 0 |
| Number of lists registered for communal councils | 4 |
| Totalling | 4 |
Submitted candidates
| Name | Number of candidates | Women | Women (%) | Men | Men (%) |
|---|---|---|---|---|---|
| Number of candidates submitted for county councils | 0 | 0 | - | 0 | - |
| Number of candidates submitted for councils of cities holding county rights | 0 | 0 | - | 0 | - |
| Number of candidates registered for communal councils | 39 | 8 | 20.51% | 31 | 79.49% |
| Number of candidates submitted for reeve, mayor and presidential elections | 1 | 1 | 100.00% | 0 | 0.00% |
| Totalling | 40 | 9 | 22.50% | 31 | 77.50% |
Average age of submitted candidates
| Name | Average age | Average age of women | Average age of men |
|---|---|---|---|
| Average age of candidates submitted for county councils | - | - | - |
| Average age of candidates for councils of cities holding county rights | - | - | - |
| Average age of candidates submitted for communal councils | 51 | 46 | 52 |
| Average age of candidates for reeve, mayor, president | 49 | 49 | - |
| Totalling | 51 | 47 | 52 |
Submitted candidates grouped by age
| Name | Number of candidates | Women | Women (%) | Men | Men (%) |
|---|---|---|---|---|---|
| 18-29 | 2 | 2 | 100.00% | 0 | 0.00% |
| 30-39 | 5 | 1 | 20.00% | 4 | 80.00% |
| 40-49 | 9 | 2 | 22.22% | 7 | 77.78% |
| 50-59 | 15 | 2 | 13.33% | 13 | 86.67% |
| 60-69 | 8 | 2 | 25.00% | 6 | 75.00% |
| 70+ | 1 | 0 | 0.00% | 1 | 100.00% |
The youngest and oldest candidate submitted
| Age | Institution | |
|---|---|---|
| Youngest | 24 | Rada Gminy Zabierzów |
| Oldest | 77 | Rada Gminy Zabierzów |