Komitet Wyborczy Wyborców FORUM SAMORZĄDOWE 2006
| Name: | Komitet Wyborczy Wyborców FORUM SAMORZĄDOWE 2006 | |
| Short name: | KWW FORUM SAMORZĄDOWE 2006 | |
| Type of committee: | Election committees established by electors | |
| Address: | Jadwisin, ul. Szaniawskiego 8, 05-140 Serock | |
| Plenipotentiary: | electoral | financial |
| Józef, Franciszek Zając | Józef Cielenkiewicz | |
The provinces where the committee has submitted lists of candidates
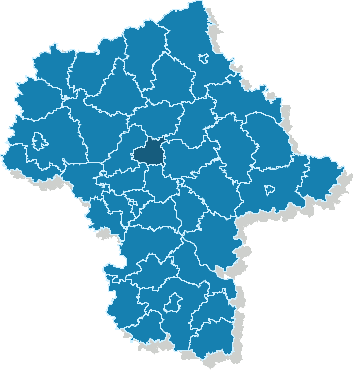
| Name |
|---|
| pow. legionowski |
The statistics of election committe
Lists submitted
| Description | Number of |
|---|---|
| Number of lists submitted for province council | 0 |
| Number of lists submitted for county councils | 4 |
| Number of lists submitted for councils of cities holding county rights | 0 |
| Number of lists submitted for districts councils of the cap. city of Warsaw | 0 |
| Number of lists registered for communal councils | 9 |
| Totalling | 13 |
Submitted candidates
| Name | Number of candidates | Women | Women (%) | Men | Men (%) |
|---|---|---|---|---|---|
| Number of candidates submitted for the province council | 0 | 0 | - | 0 | - |
| Number of candidates submitted for county councils | 37 | 18 | 48.65% | 19 | 51.35% |
| Number of candidates submitted for councils of cities holding county rights | 0 | 0 | - | 0 | - |
| Number of candidates submitted for districts councils of the cap. city of Warsaw | 0 | 0 | - | 0 | - |
| Number of candidates registered for communal councils | 14 | 3 | 21.43% | 11 | 78.57% |
| Number of candidates submitted for reeve, mayor and presidential elections | 1 | 0 | 0.00% | 1 | 100.00% |
| Totalling | 52 | 21 | 40.38% | 31 | 59.62% |
Average age of submitted candidates
| Name | Average age | Average age of women | Average age of men |
|---|---|---|---|
| Average age of candidates submitted for the province council | - | - | - |
| Average age of candidates submitted for county councils | 47 | 49 | 44 |
| Average age of candidates for councils of cities holding county rights | - | - | - |
| Average age of candidates for districts councils of the cap. city of Warsaw | - | - | - |
| Average age of candidates submitted for communal councils | 52 | 50 | 53 |
| Average age of candidates for reeve, mayor, president | 47 | - | 47 |
| Totalling | 48 | 49 | 47 |
Submitted candidates grouped by age
| Name | Number of candidates | Women | Women (%) | Men | Men (%) |
|---|---|---|---|---|---|
| 18-29 | 4 | 0 | 0.00% | 4 | 100.00% |
| 30-39 | 11 | 5 | 45.45% | 6 | 54.55% |
| 40-49 | 7 | 3 | 42.86% | 4 | 57.14% |
| 50-59 | 22 | 9 | 40.91% | 13 | 59.09% |
| 60-69 | 7 | 4 | 57.14% | 3 | 42.86% |
| 70+ | 1 | 0 | 0.00% | 1 | 100.00% |
The youngest and oldest candidate submitted
| Age | Institution | |
|---|---|---|
| Youngest | 26 | Rada Powiatu w Legionowie |
| Oldest | 79 | Rada Powiatu w Legionowie |