Komitet Wyborczy Wyborców "Piast"
| Name: | Komitet Wyborczy Wyborców "Piast" | |
| Short name: | KWW "Piast" | |
| Type of committee: | Election committees established by electors | |
| Address: | Św. Ducha 21, 88-320, Strzelno | |
| Plenipotentiary: | electoral | financial |
| Karol Piotr Dłutkowski | Jan Zdzisław Szarek | |
The provinces where the committee has submitted lists of candidates
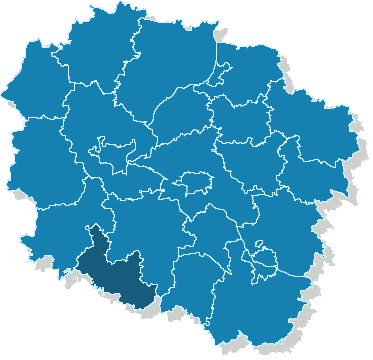
| Name |
|---|
| pow. mogileński |
The statistics of election committe
Lists submitted
| Description | Number of |
|---|---|
| Number of lists submitted for province council | 0 |
| Number of lists submitted for county councils | 3 |
| Number of lists submitted for councils of cities holding county rights | 0 |
| Number of lists submitted for districts councils of the cap. city of Warsaw | 0 |
| Number of lists registered for communal councils | 9 |
| Totalling | 12 |
Submitted candidates
| Name | Number of candidates | Women | Women (%) | Men | Men (%) |
|---|---|---|---|---|---|
| Number of candidates submitted for the province council | 0 | 0 | - | 0 | - |
| Number of candidates submitted for county councils | 31 | 3 | 9.68% | 28 | 90.32% |
| Number of candidates submitted for councils of cities holding county rights | 0 | 0 | - | 0 | - |
| Number of candidates submitted for districts councils of the cap. city of Warsaw | 0 | 0 | - | 0 | - |
| Number of candidates registered for communal councils | 31 | 10 | 32.26% | 21 | 67.74% |
| Number of candidates submitted for reeve, mayor and presidential elections | 2 | 0 | 0.00% | 2 | 100.00% |
| Totalling | 64 | 13 | 20.31% | 51 | 79.69% |
Average age of submitted candidates
| Name | Average age | Average age of women | Average age of men |
|---|---|---|---|
| Average age of candidates submitted for the province council | - | - | - |
| Average age of candidates submitted for county councils | 46 | 47 | 46 |
| Average age of candidates for councils of cities holding county rights | - | - | - |
| Average age of candidates for districts councils of the cap. city of Warsaw | - | - | - |
| Average age of candidates submitted for communal councils | 45 | 44 | 46 |
| Average age of candidates for reeve, mayor, president | 46 | - | 46 |
| Totalling | 46 | 45 | 46 |
Submitted candidates grouped by age
| Name | Number of candidates | Women | Women (%) | Men | Men (%) |
|---|---|---|---|---|---|
| 18-29 | 6 | 1 | 16.67% | 5 | 83.33% |
| 30-39 | 11 | 1 | 9.09% | 10 | 90.91% |
| 40-49 | 19 | 7 | 36.84% | 12 | 63.16% |
| 50-59 | 22 | 4 | 18.18% | 18 | 81.82% |
| 60-69 | 6 | 0 | 0.00% | 6 | 100.00% |
| 70+ | 0 | 0 | — | 0 | — |
The youngest and oldest candidate submitted
| Age | Institution | |
|---|---|---|
| Youngest | 20 | Rada Gminy Dąbrowa |
| Oldest | 67 | Rada Powiatu Mogileńskiego |