Komitet Wyborczy Polskiego Stronnictwa Ludowego
| Name: | Komitet Wyborczy Polskiego Stronnictwa Ludowego | |
| Short name: | Komitet Wyborczy PSL | |
| Type of committee: | Election committees established by political parties | |
| Address: | ul. Kopernika 36/40, 00-924 Warszawa | |
| Plenipotentiary: | electoral | financial |
| Józef Szczepańczyk | Henryk Cichecki | |
The provinces where the committee has submitted lists of candidates
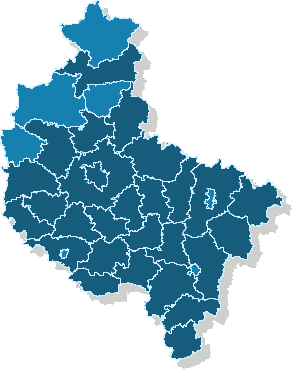
Sejmik Województwa Wielkopolskiego
Submitted candidates
| Name | Number of candidates | Women | Women (%) | Men | Men (%) | Status |
|---|---|---|---|---|---|---|
| Sum: | 74 | 9 | 12.16% | 65 | 87.84% | |
| Constituency no. 1 | 12 | 1 | 8.33% | 11 | 91.67% |
|
| Constituency no. 2 | 13 | 2 | 15.38% | 11 | 84.62% |
|
| Constituency no. 3 | 14 | 3 | 21.43% | 11 | 78.57% |
|
| Constituency no. 4 | 10 | 0 | 0.00% | 10 | 100.00% |
|
| Constituency no. 5 | 13 | 1 | 7.69% | 12 | 92.31% |
|
| Constituency no. 6 | 12 | 2 | 16.67% | 10 | 83.33% |
|
Age of the candidates
| Name | Average age | Average age of women | Average age of men | Oldest | Youngest |
|---|---|---|---|---|---|
| Constituency no. 1 | 53 | 47 | 53 | 67 | 34 |
| Constituency no. 2 | 53 | 52 | 53 | 69 | 32 |
| Constituency no. 3 | 44 | 47 | 44 | 56 | 24 |
| Constituency no. 4 | 49 | 49 | 60 | 35 | |
| Constituency no. 5 | 50 | 61 | 49 | 63 | 27 |
| Constituency no. 6 | 51 | 43 | 53 | 69 | 29 |
The statistics of election committe
Lists submitted
| Description | Number of |
|---|---|
| Number of lists submitted for province council | 6 |
| Number of lists submitted for county councils | 99 |
| Number of lists submitted for councils of cities holding county rights | 7 |
| Number of lists registered for communal councils | 790 |
| Totalling | 902 |
Submitted candidates
| Name | Number of candidates | Women | Women (%) | Men | Men (%) |
|---|---|---|---|---|---|
| Number of candidates submitted for the province council | 74 | 9 | 12.16% | 65 | 87.84% |
| Number of candidates submitted for county councils | 781 | 159 | 20.36% | 622 | 79.64% |
| Number of candidates submitted for councils of cities holding county rights | 38 | 16 | 42.11% | 22 | 57.89% |
| Number of candidates registered for communal councils | 1234 | 249 | 20.18% | 985 | 79.82% |
| Number of candidates submitted for reeve, mayor and presidential elections | 51 | 3 | 5.88% | 48 | 94.12% |
| Totalling | 2,178 | 436 | 20.02% | 1,742 | 79.98% |
Average age of submitted candidates
| Name | Average age | Average age of women | Average age of men |
|---|---|---|---|
| Average age of candidates submitted for the province council | 50 | 49 | 50 |
| Average age of candidates submitted for county councils | 47 | 45 | 48 |
| Average age of candidates for councils of cities holding county rights | 39 | 39 | 39 |
| Average age of candidates submitted for communal councils | 47 | 43 | 47 |
| Average age of candidates for reeve, mayor, president | 49 | 46 | 49 |
| Totalling | 47 | 44 | 47 |
Submitted candidates grouped by age
| Name | Number of candidates | Women | Women (%) | Men | Men (%) |
|---|---|---|---|---|---|
| 18-29 | 179 | 48 | 26.82% | 131 | 73.18% |
| 30-39 | 328 | 80 | 24.39% | 248 | 75.61% |
| 40-49 | 672 | 158 | 23.51% | 514 | 76.49% |
| 50-59 | 757 | 132 | 17.44% | 625 | 82.56% |
| 60-69 | 213 | 16 | 7.51% | 197 | 92.49% |
| 70+ | 29 | 2 | 6.90% | 27 | 93.10% |
The youngest and oldest candidate submitted
| Age | Institution | |
|---|---|---|
| Youngest | 19 | Rada Miejska w Mosinie |
| Oldest | 79 | Rada Gminy Babiak |