Komitet Wyborczy Wyborców Sprawny Samorząd
| Name: | Komitet Wyborczy Wyborców Sprawny Samorząd | |
| Short name: | KWW Sprawny Samorząd | |
| Type of committee: | Election committees established by electors | |
| Address: | ul. Iłżecka 2, 27-300 Lipsko | |
| Plenipotentiary: | electoral | financial |
| Bogdan Mordak | Marek Bronisław Więcław | |
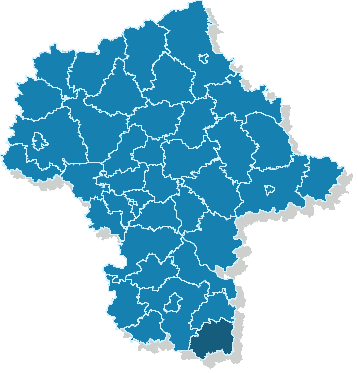
The provinces where the committee has submitted lists of candidates
| Name |
|---|
| pow. lipski |
The statistics of election committe
Lists submitted
| Description | Number of |
|---|---|
| Number of lists submitted for province council | 0 |
| Number of lists submitted for county councils | 4 |
| Number of lists submitted for councils of cities holding county rights | 0 |
| Number of lists submitted for districts councils of the cap. city of Warsaw | 0 |
| Number of lists registered for communal councils | 39 |
| Totalling | 43 |
Submitted candidates
| Name | Number of candidates | Women | Women (%) | Men | Men (%) |
|---|---|---|---|---|---|
| Number of candidates submitted for the province council | 0 | 0 | - | 0 | - |
| Number of candidates submitted for county councils | 27 | 4 | 14.81% | 23 | 85.19% |
| Number of candidates submitted for councils of cities holding county rights | 0 | 0 | - | 0 | - |
| Number of candidates submitted for districts councils of the cap. city of Warsaw | 0 | 0 | - | 0 | - |
| Number of candidates registered for communal councils | 48 | 18 | 37.50% | 30 | 62.50% |
| Number of candidates submitted for reeve, mayor and presidential elections | 4 | 1 | 25.00% | 3 | 75.00% |
| Totalling | 79 | 23 | 29.11% | 56 | 70.89% |
Average age of submitted candidates
| Name | Average age | Average age of women | Average age of men |
|---|---|---|---|
| Average age of candidates submitted for the province council | - | - | - |
| Average age of candidates submitted for county councils | 49 | 41 | 50 |
| Average age of candidates for councils of cities holding county rights | - | - | - |
| Average age of candidates for districts councils of the cap. city of Warsaw | - | - | - |
| Average age of candidates submitted for communal councils | 48 | 42 | 51 |
| Average age of candidates for reeve, mayor, president | 49 | 45 | 51 |
| Totalling | 48 | 42 | 50 |
Submitted candidates grouped by age
| Name | Number of candidates | Women | Women (%) | Men | Men (%) |
|---|---|---|---|---|---|
| 18-29 | 5 | 2 | 40.00% | 3 | 60.00% |
| 30-39 | 11 | 6 | 54.55% | 5 | 45.45% |
| 40-49 | 24 | 12 | 50.00% | 12 | 50.00% |
| 50-59 | 29 | 3 | 10.34% | 26 | 89.66% |
| 60-69 | 9 | 0 | 0.00% | 9 | 100.00% |
| 70+ | 1 | 0 | 0.00% | 1 | 100.00% |
The youngest and oldest candidate submitted
| Age | Institution | |
|---|---|---|
| Youngest | 25 | Rada Gminy w Chotczy |
| Oldest | 73 | Rada Gminy w Solcu nad Wisłą |