Komitet Wyborczy Wyborców FORUM SAMORZĄDOWE-ZIEMIA GORLICKA
| Name: | Komitet Wyborczy Wyborców FORUM SAMORZĄDOWE-ZIEMIA GORLICKA | |
| Short name: | KWW FORUM SAMORZĄDOWE-ZIEMIA GORLICKA | |
| Type of committee: | Election committees established by electors | |
| Address: | ul. Biecka 36, 38-300 Gorlice | |
| Plenipotentiary: | electoral | financial |
| Marian Janusz | Ryszard Tumidajski | |
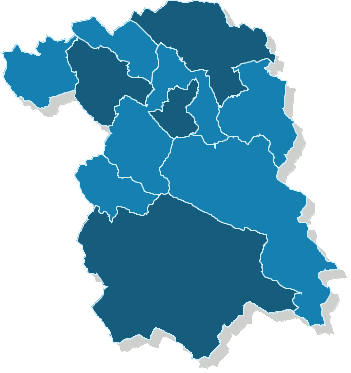
The counties and cities holding county rights where the committee has submitted lists of candidates
| Name |
|---|
| gm. Biecz |
| gm. Łużna |
| gm. Uście Gorlickie |
| m. Gorlice |
Rada Powiatu Gorlickiego
Submitted candidates
| Name | Number of candidates | Women | Women (%) | Men | Men (%) | Status |
|---|---|---|---|---|---|---|
| Sum: | 29 | 4 | 13.79% | 25 | 86.21% | |
| Constituency no. 1 | 7 | 1 | 14.29% | 6 | 85.71% |
|
| Constituency no. 2 | 4 | 0 | 0.00% | 4 | 100.00% |
|
| Constituency no. 3 | 4 | 1 | 25.00% | 3 | 75.00% |
|
| Constituency no. 4 | 6 | 0 | 0.00% | 6 | 100.00% |
|
| Constituency no. 5 | 8 | 2 | 25.00% | 6 | 75.00% |
|
Age of the candidates
| Name | Average age | Average age of women | Average age of men | Oldest | Youngest |
|---|---|---|---|---|---|
| Constituency no. 1 | 47 | 45 | 48 | 58 | 22 |
| Constituency no. 2 | 41 | 41 | 54 | 33 | |
| Constituency no. 3 | 45 | 56 | 42 | 56 | 32 |
| Constituency no. 4 | 46 | 46 | 59 | 38 | |
| Constituency no. 5 | 49 | 46 | 50 | 70 | 44 |
The statistics of election committe
Lists submitted
| Description | Number of |
|---|---|
| Number of lists submitted for county councils | 5 |
| Number of lists submitted for councils of cities holding county rights | 0 |
| Number of lists registered for communal councils | 13 |
| Totalling | 18 |
Submitted candidates
| Name | Number of candidates | Women | Women (%) | Men | Men (%) |
|---|---|---|---|---|---|
| Number of candidates submitted for county councils | 29 | 4 | 13.79% | 25 | 86.21% |
| Number of candidates submitted for councils of cities holding county rights | 0 | 0 | - | 0 | - |
| Number of candidates registered for communal councils | 42 | 10 | 23.81% | 32 | 76.19% |
| Number of candidates submitted for reeve, mayor and presidential elections | 2 | 0 | 0.00% | 2 | 100.00% |
| Totalling | 73 | 14 | 19.18% | 59 | 80.82% |
Average age of submitted candidates
| Name | Average age | Average age of women | Average age of men |
|---|---|---|---|
| Average age of candidates submitted for county councils | 46 | 48 | 46 |
| Average age of candidates for councils of cities holding county rights | - | - | - |
| Average age of candidates submitted for communal councils | 46 | 42 | 47 |
| Average age of candidates for reeve, mayor, president | 52 | - | 52 |
| Totalling | 46 | 44 | 47 |
Submitted candidates grouped by age
| Name | Number of candidates | Women | Women (%) | Men | Men (%) |
|---|---|---|---|---|---|
| 18-29 | 8 | 2 | 25.00% | 6 | 75.00% |
| 30-39 | 11 | 1 | 9.09% | 10 | 90.91% |
| 40-49 | 24 | 6 | 25.00% | 18 | 75.00% |
| 50-59 | 22 | 5 | 22.73% | 17 | 77.27% |
| 60-69 | 5 | 0 | 0.00% | 5 | 100.00% |
| 70+ | 3 | 0 | 0.00% | 3 | 100.00% |
The youngest and oldest candidate submitted
| Age | Institution | |
|---|---|---|
| Youngest | 22 | Rada Miasta Gorlice |
| Oldest | 77 | Rada Miasta Gorlice |