Komitet Wyborczy Wyborców PARTNERSTWO W SAMORZĄDZIE
| Name: | Komitet Wyborczy Wyborców PARTNERSTWO W SAMORZĄDZIE | |
| Short name: | "KWW" PARTNERSTWO W SAMORZĄDZIE | |
| Type of committee: | Election committees established by electors | |
| Address: | ul. Słowackiego 106A, 32-400 Myślenice | |
| Plenipotentiary: | electoral | financial |
| Adam Giza | Czesław Bisztyga | |
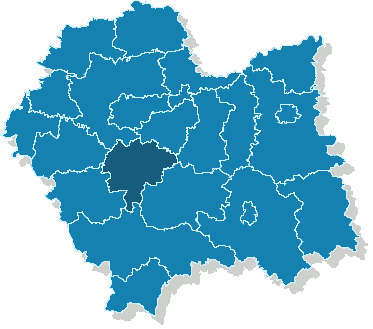
The provinces where the committee has submitted lists of candidates
| Name |
|---|
| pow. myślenicki |
The statistics of election committe
Lists submitted
| Description | Number of |
|---|---|
| Number of lists submitted for province council | 0 |
| Number of lists submitted for county councils | 5 |
| Number of lists submitted for councils of cities holding county rights | 0 |
| Number of lists submitted for districts councils of the cap. city of Warsaw | 0 |
| Number of lists registered for communal councils | 4 |
| Totalling | 9 |
Submitted candidates
| Name | Number of candidates | Women | Women (%) | Men | Men (%) |
|---|---|---|---|---|---|
| Number of candidates submitted for the province council | 0 | 0 | - | 0 | - |
| Number of candidates submitted for county councils | 26 | 9 | 34.62% | 17 | 65.38% |
| Number of candidates submitted for councils of cities holding county rights | 0 | 0 | - | 0 | - |
| Number of candidates submitted for districts councils of the cap. city of Warsaw | 0 | 0 | - | 0 | - |
| Number of candidates registered for communal councils | 37 | 7 | 18.92% | 30 | 81.08% |
| Number of candidates submitted for reeve, mayor and presidential elections | 0 | 0 | - | 0 | - |
| Totalling | 63 | 16 | 25.40% | 47 | 74.60% |
Average age of submitted candidates
| Name | Average age | Average age of women | Average age of men |
|---|---|---|---|
| Average age of candidates submitted for the province council | - | - | - |
| Average age of candidates submitted for county councils | 46 | 45 | 46 |
| Average age of candidates for councils of cities holding county rights | - | - | - |
| Average age of candidates for districts councils of the cap. city of Warsaw | - | - | - |
| Average age of candidates submitted for communal councils | 44 | 43 | 44 |
| Average age of candidates for reeve, mayor, president | - | - | - |
| Totalling | 44 | 44 | 45 |
Submitted candidates grouped by age
| Name | Number of candidates | Women | Women (%) | Men | Men (%) |
|---|---|---|---|---|---|
| 18-29 | 6 | 1 | 16.67% | 5 | 83.33% |
| 30-39 | 10 | 4 | 40.00% | 6 | 60.00% |
| 40-49 | 22 | 4 | 18.18% | 18 | 81.82% |
| 50-59 | 22 | 6 | 27.27% | 16 | 72.73% |
| 60-69 | 3 | 1 | 33.33% | 2 | 66.67% |
| 70+ | 0 | 0 | — | 0 | — |
The youngest and oldest candidate submitted
| Age | Institution | |
|---|---|---|
| Youngest | 20 | Rada Powiatu w Myślenicach |
| Oldest | 66 | Rada Miejska w Myślenicach |