Komitet Wyborczy Wyborców Samorządowe Przymierze Śląskie
| Name: | Komitet Wyborczy Wyborców Samorządowe Przymierze Śląskie | |
| Short name: | KWW Samorządowe Przymierze Śląskie | |
| Type of committee: | Election committees established by electors | |
| Address: | ul. Częstochowska 62/1, 42-600 Tarnowskie Góry | |
| Plenipotentiary: | electoral | financial |
| Andrzej Anczok | Marek Ziaja | |
The provinces where the committee has submitted lists of candidates
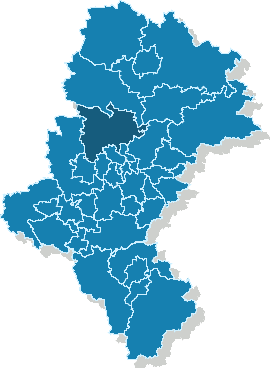
| Name |
|---|
| pow. tarnogórski |
The statistics of election committe
Lists submitted
| Description | Number of |
|---|---|
| Number of lists submitted for province council | 0 |
| Number of lists submitted for county councils | 6 |
| Number of lists submitted for councils of cities holding county rights | 0 |
| Number of lists submitted for districts councils of the cap. city of Warsaw | 0 |
| Number of lists registered for communal councils | 4 |
| Totalling | 10 |
Submitted candidates
| Name | Number of candidates | Women | Women (%) | Men | Men (%) |
|---|---|---|---|---|---|
| Number of candidates submitted for the province council | 0 | 0 | - | 0 | - |
| Number of candidates submitted for county councils | 43 | 6 | 13.95% | 37 | 86.05% |
| Number of candidates submitted for councils of cities holding county rights | 0 | 0 | - | 0 | - |
| Number of candidates submitted for districts councils of the cap. city of Warsaw | 0 | 0 | - | 0 | - |
| Number of candidates registered for communal councils | 36 | 10 | 27.78% | 26 | 72.22% |
| Number of candidates submitted for reeve, mayor and presidential elections | 1 | 0 | 0.00% | 1 | 100.00% |
| Totalling | 80 | 16 | 20.00% | 64 | 80.00% |
Average age of submitted candidates
| Name | Average age | Average age of women | Average age of men |
|---|---|---|---|
| Average age of candidates submitted for the province council | - | - | - |
| Average age of candidates submitted for county councils | 46 | 44 | 46 |
| Average age of candidates for councils of cities holding county rights | - | - | - |
| Average age of candidates for districts councils of the cap. city of Warsaw | - | - | - |
| Average age of candidates submitted for communal councils | 46 | 40 | 48 |
| Average age of candidates for reeve, mayor, president | 62 | - | 62 |
| Totalling | 46 | 41 | 47 |
Submitted candidates grouped by age
| Name | Number of candidates | Women | Women (%) | Men | Men (%) |
|---|---|---|---|---|---|
| 18-29 | 6 | 2 | 33.33% | 4 | 66.67% |
| 30-39 | 16 | 6 | 37.50% | 10 | 62.50% |
| 40-49 | 26 | 3 | 11.54% | 23 | 88.46% |
| 50-59 | 22 | 3 | 13.64% | 19 | 86.36% |
| 60-69 | 9 | 2 | 22.22% | 7 | 77.78% |
| 70+ | 1 | 0 | 0.00% | 1 | 100.00% |
The youngest and oldest candidate submitted
| Age | Institution | |
|---|---|---|
| Youngest | 21 | Rada Miejska w Tarnowskich Górach |
| Oldest | 72 | Rada Powiatu Tarnogórskiego |