Komitet Wyborczy Krajowej Partii Emerytów i Rencistów
| Name: | Komitet Wyborczy Krajowej Partii Emerytów i Rencistów | |
| Short name: | KW Krajowej Partii Emerytów i Rencistów | |
| Type of committee: | Election committees established by political parties | |
| Address: | ul. Nowogrodzka 7/9 lok. 35, 00-513 Warszawa | |
| Plenipotentiary: | electoral | financial |
| Tadeusz Henryk Staniewski | Modest Skikiewicz | |
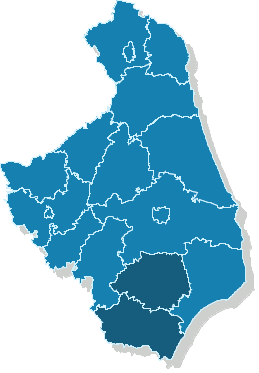
The provinces where the committee has submitted lists of candidates
| Name |
|---|
| pow. bielski |
| pow. siemiatycki |
Sejmik Województwa Podlaskiego
Submitted candidates
| Name | Number of candidates | Women | Women (%) | Men | Men (%) | Status |
|---|---|---|---|---|---|---|
| Sum: | 56 | 17 | 30.36% | 39 | 69.64% | |
| Constituency no. 1 | 14 | 8 | 57.14% | 6 | 42.86% |
|
| Constituency no. 2 | 8 | 4 | 50.00% | 4 | 50.00% |
|
| Constituency no. 3 | 9 | 0 | 0.00% | 9 | 100.00% |
|
| Constituency no. 4 | 10 | 1 | 10.00% | 9 | 90.00% |
|
| Constituency no. 5 | 15 | 4 | 26.67% | 11 | 73.33% |
|
Age of the candidates
| Name | Average age | Average age of women | Average age of men | Oldest | Youngest |
|---|---|---|---|---|---|
| Constituency no. 1 | 59 | 60 | 59 | 68 | 36 |
| Constituency no. 2 | 58 | 52 | 63 | 66 | 38 |
| Constituency no. 3 | 58 | 58 | 70 | 37 | |
| Constituency no. 4 | 60 | 53 | 61 | 69 | 46 |
| Constituency no. 5 | 52 | 45 | 55 | 75 | 28 |
The statistics of election committe
Lists submitted
| Description | Number of |
|---|---|
| Number of lists submitted for province council | 5 |
| Number of lists submitted for county councils | 0 |
| Number of lists submitted for councils of cities holding county rights | 0 |
| Number of lists registered for communal councils | 5 |
| Totalling | 10 |
Submitted candidates
| Name | Number of candidates | Women | Women (%) | Men | Men (%) |
|---|---|---|---|---|---|
| Number of candidates submitted for the province council | 56 | 17 | 30.36% | 39 | 69.64% |
| Number of candidates submitted for county councils | 0 | 0 | - | 0 | - |
| Number of candidates submitted for councils of cities holding county rights | 0 | 0 | - | 0 | - |
| Number of candidates registered for communal councils | 26 | 9 | 34.62% | 17 | 65.38% |
| Number of candidates submitted for reeve, mayor and presidential elections | 1 | 0 | 0.00% | 1 | 100.00% |
| Totalling | 83 | 26 | 31.33% | 57 | 68.67% |
Average age of submitted candidates
| Name | Average age | Average age of women | Average age of men |
|---|---|---|---|
| Average age of candidates submitted for the province council | 57 | 54 | 58 |
| Average age of candidates submitted for county councils | - | - | - |
| Average age of candidates for councils of cities holding county rights | - | - | - |
| Average age of candidates submitted for communal councils | 47 | 49 | 45 |
| Average age of candidates for reeve, mayor, president | 46 | - | 46 |
| Totalling | 54 | 52 | 54 |
Submitted candidates grouped by age
| Name | Number of candidates | Women | Women (%) | Men | Men (%) |
|---|---|---|---|---|---|
| 18-29 | 7 | 2 | 28.57% | 5 | 71.43% |
| 30-39 | 5 | 2 | 40.00% | 3 | 60.00% |
| 40-49 | 16 | 4 | 25.00% | 12 | 75.00% |
| 50-59 | 19 | 10 | 52.63% | 9 | 47.37% |
| 60-69 | 32 | 8 | 25.00% | 24 | 75.00% |
| 70+ | 4 | 0 | 0.00% | 4 | 100.00% |
The youngest and oldest candidate submitted
| Age | Institution | |
|---|---|---|
| Youngest | 21 | Rada Miasta Bielsk Podlaski |
| Oldest | 75 | Rada Miasta Bielsk Podlaski |