Komitet Wyborczy Ruch Autonomii Śląska
| Name: | Komitet Wyborczy Ruch Autonomii Śląska | |
| Short name: | KW Ruch Autonomii Śląska | |
| Type of committee: | Election committees established by organisations | |
| Address: | Plac Wolności 7, 44-200 Rybnik | |
| Plenipotentiary: | electoral | financial |
| Marek Marcisz | Leon Swaczyna | |
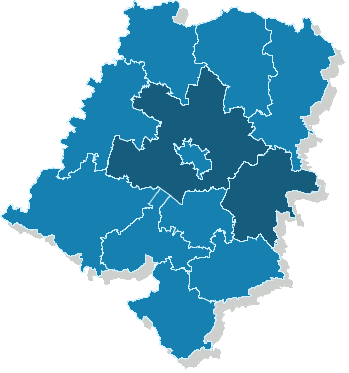
The provinces where the committee has submitted lists of candidates
| Name |
|---|
| pow. opolski |
| pow. strzelecki |
Sejmik Województwa Opolskiego
Submitted candidates
| Name | Number of candidates | Women | Women (%) | Men | Men (%) | Status |
|---|---|---|---|---|---|---|
| Sum: | 27 | 4 | 14.81% | 23 | 85.19% | |
| Constituency no. 1 | 6 | 1 | 16.67% | 5 | 83.33% |
|
| Constituency no. 2 | 5 | 0 | 0.00% | 5 | 100.00% |
|
| Constituency no. 3 | 6 | 1 | 16.67% | 5 | 83.33% |
|
| Constituency no. 4 | 5 | 0 | 0.00% | 5 | 100.00% |
|
| Constituency no. 5 | 5 | 2 | 40.00% | 3 | 60.00% |
|
Age of the candidates
| Name | Average age | Average age of women | Average age of men | Oldest | Youngest |
|---|---|---|---|---|---|
| Constituency no. 1 | 33 | 23 | 35 | 41 | 23 |
| Constituency no. 2 | 27 | 27 | 34 | 20 | |
| Constituency no. 3 | 29 | 55 | 24 | 55 | 20 |
| Constituency no. 4 | 41 | 41 | 59 | 20 | |
| Constituency no. 5 | 40 | 40 | 41 | 55 | 30 |
The statistics of election committe
Lists submitted
| Description | Number of |
|---|---|
| Number of lists submitted for province council | 5 |
| Number of lists submitted for county councils | 3 |
| Number of lists submitted for councils of cities holding county rights | 0 |
| Number of lists registered for communal councils | 5 |
| Totalling | 13 |
Submitted candidates
| Name | Number of candidates | Women | Women (%) | Men | Men (%) |
|---|---|---|---|---|---|
| Number of candidates submitted for the province council | 27 | 4 | 14.81% | 23 | 85.19% |
| Number of candidates submitted for county councils | 11 | 0 | 0.00% | 11 | 100.00% |
| Number of candidates submitted for councils of cities holding county rights | 0 | 0 | - | 0 | - |
| Number of candidates registered for communal councils | 12 | 2 | 16.67% | 10 | 83.33% |
| Number of candidates submitted for reeve, mayor and presidential elections | 1 | 0 | 0.00% | 1 | 100.00% |
| Totalling | 51 | 6 | 11.76% | 45 | 88.24% |
Average age of submitted candidates
| Name | Average age | Average age of women | Average age of men |
|---|---|---|---|
| Average age of candidates submitted for the province council | 34 | 39 | 33 |
| Average age of candidates submitted for county councils | 38 | - | 38 |
| Average age of candidates for councils of cities holding county rights | - | - | - |
| Average age of candidates submitted for communal councils | 42 | 42 | 42 |
| Average age of candidates for reeve, mayor, president | 34 | - | 34 |
| Totalling | 36 | 40 | 36 |
Submitted candidates grouped by age
| Name | Number of candidates | Women | Women (%) | Men | Men (%) |
|---|---|---|---|---|---|
| 18-29 | 17 | 1 | 5.88% | 16 | 94.12% |
| 30-39 | 16 | 1 | 6.25% | 15 | 93.75% |
| 40-49 | 7 | 3 | 42.86% | 4 | 57.14% |
| 50-59 | 10 | 1 | 10.00% | 9 | 90.00% |
| 60-69 | 0 | 0 | — | 0 | — |
| 70+ | 1 | 0 | 0.00% | 1 | 100.00% |
The youngest and oldest candidate submitted
| Age | Institution | |
|---|---|---|
| Youngest | 19 | Rada Powiatu Strzeleckiego |
| Oldest | 74 | Rada Powiatu Strzeleckiego |