Komitet Wyborczy Wyborców "Moja Ojczyzna"
| Name: | Komitet Wyborczy Wyborców "Moja Ojczyzna" | |
| Short name: | KWW "Moja Ojczyzna" | |
| Type of committee: | Election committees established by electors | |
| Address: | ul. Knyszyńska 2 a; 16-140 Korycin | |
| Plenipotentiary: | electoral | financial |
| Jerzy Pogorzelski | Teresa Bałakier | |
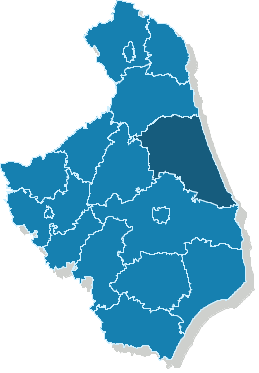
The provinces where the committee has submitted lists of candidates
| Name |
|---|
| pow. sokólski |
The statistics of election committe
Lists submitted
| Description | Number of |
|---|---|
| Number of lists submitted for province council | 0 |
| Number of lists submitted for county councils | 4 |
| Number of lists submitted for councils of cities holding county rights | 0 |
| Number of lists submitted for districts councils of the cap. city of Warsaw | 0 |
| Number of lists registered for communal councils | 51 |
| Totalling | 55 |
Submitted candidates
| Name | Number of candidates | Women | Women (%) | Men | Men (%) |
|---|---|---|---|---|---|
| Number of candidates submitted for the province council | 0 | 0 | - | 0 | - |
| Number of candidates submitted for county councils | 23 | 2 | 8.70% | 21 | 91.30% |
| Number of candidates submitted for councils of cities holding county rights | 0 | 0 | - | 0 | - |
| Number of candidates submitted for districts councils of the cap. city of Warsaw | 0 | 0 | - | 0 | - |
| Number of candidates registered for communal councils | 58 | 3 | 5.17% | 55 | 94.83% |
| Number of candidates submitted for reeve, mayor and presidential elections | 4 | 0 | 0.00% | 4 | 100.00% |
| Totalling | 85 | 5 | 5.88% | 80 | 94.12% |
Average age of submitted candidates
| Name | Average age | Average age of women | Average age of men |
|---|---|---|---|
| Average age of candidates submitted for the province council | - | - | - |
| Average age of candidates submitted for county councils | 52 | 48 | 53 |
| Average age of candidates for councils of cities holding county rights | - | - | - |
| Average age of candidates for districts councils of the cap. city of Warsaw | - | - | - |
| Average age of candidates submitted for communal councils | 45 | 48 | 45 |
| Average age of candidates for reeve, mayor, president | 45 | - | 45 |
| Totalling | 47 | 48 | 47 |
Submitted candidates grouped by age
| Name | Number of candidates | Women | Women (%) | Men | Men (%) |
|---|---|---|---|---|---|
| 18-29 | 2 | 0 | 0.00% | 2 | 100.00% |
| 30-39 | 19 | 1 | 5.26% | 18 | 94.74% |
| 40-49 | 28 | 3 | 10.71% | 25 | 89.29% |
| 50-59 | 27 | 0 | 0.00% | 27 | 100.00% |
| 60-69 | 9 | 1 | 11.11% | 8 | 88.89% |
| 70+ | 0 | 0 | — | 0 | — |
The youngest and oldest candidate submitted
| Age | Institution | |
|---|---|---|
| Youngest | 25 | Rada Miejska w Suchowoli |
| Oldest | 68 | Rada Powiatu Sokólskiego |