Komitet Wyborczy Wyborców Przyszłość
| Name: | Komitet Wyborczy Wyborców Przyszłość | |
| Short name: | KWW Przyszłość | |
| Type of committee: | Election committees established by electors | |
| Address: | ul. Młyńska 1/3, 86-200 Chełmno | |
| Plenipotentiary: | electoral | financial |
| Andrzej Maria Tarnawski | Danuta Koenner | |
The provinces where the committee has submitted lists of candidates
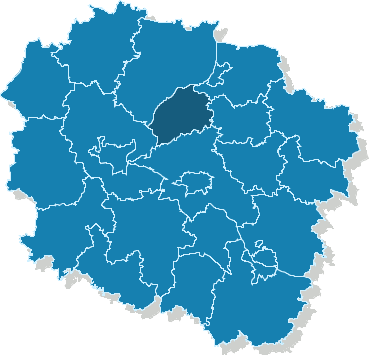
| Name |
|---|
| pow. chełmiński |
The statistics of election committe
Lists submitted
| Description | Number of |
|---|---|
| Number of lists submitted for province council | 0 |
| Number of lists submitted for county councils | 4 |
| Number of lists submitted for councils of cities holding county rights | 0 |
| Number of lists submitted for districts councils of the cap. city of Warsaw | 0 |
| Number of lists registered for communal councils | 15 |
| Totalling | 19 |
Submitted candidates
| Name | Number of candidates | Women | Women (%) | Men | Men (%) |
|---|---|---|---|---|---|
| Number of candidates submitted for the province council | 0 | 0 | - | 0 | - |
| Number of candidates submitted for county councils | 23 | 5 | 21.74% | 18 | 78.26% |
| Number of candidates submitted for councils of cities holding county rights | 0 | 0 | - | 0 | - |
| Number of candidates submitted for districts councils of the cap. city of Warsaw | 0 | 0 | - | 0 | - |
| Number of candidates registered for communal councils | 61 | 14 | 22.95% | 47 | 77.05% |
| Number of candidates submitted for reeve, mayor and presidential elections | 2 | 0 | 0.00% | 2 | 100.00% |
| Totalling | 86 | 19 | 22.09% | 67 | 77.91% |
Average age of submitted candidates
| Name | Average age | Average age of women | Average age of men |
|---|---|---|---|
| Average age of candidates submitted for the province council | - | - | - |
| Average age of candidates submitted for county councils | 47 | 48 | 47 |
| Average age of candidates for councils of cities holding county rights | - | - | - |
| Average age of candidates for districts councils of the cap. city of Warsaw | - | - | - |
| Average age of candidates submitted for communal councils | 45 | 44 | 45 |
| Average age of candidates for reeve, mayor, president | 43 | - | 43 |
| Totalling | 45 | 45 | 46 |
Submitted candidates grouped by age
| Name | Number of candidates | Women | Women (%) | Men | Men (%) |
|---|---|---|---|---|---|
| 18-29 | 4 | 0 | 0.00% | 4 | 100.00% |
| 30-39 | 20 | 4 | 20.00% | 16 | 80.00% |
| 40-49 | 31 | 9 | 29.03% | 22 | 70.97% |
| 50-59 | 25 | 5 | 20.00% | 20 | 80.00% |
| 60-69 | 3 | 1 | 33.33% | 2 | 66.67% |
| 70+ | 3 | 0 | 0.00% | 3 | 100.00% |
The youngest and oldest candidate submitted
| Age | Institution | |
|---|---|---|
| Youngest | 26 | Rada Miasta Chełmna |
| Oldest | 74 | Rada Powiatu w Chełmnie |