Komitet Wyborczy Wyborców NASZA GMINA ZABIERZÓW
| Name: | Komitet Wyborczy Wyborców NASZA GMINA ZABIERZÓW | |
| Short name: | KWW NASZA GMINA ZABIERZÓW | |
| Type of committee: | Election committees established by electors | |
| Address: | ul. Śląska 42, 32-080 Zabierzów | |
| Plenipotentiary: | electoral | financial |
| Jerzy Cywicki | Józef Woch | |
The counties and cities holding county rights where the committee has submitted lists of candidates
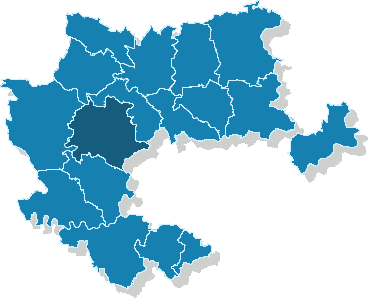
| Name |
|---|
| gm. Zabierzów |
The statistics of election committe
Lists submitted
| Description | Number of |
|---|---|
| Number of lists submitted for county councils | 0 |
| Number of lists submitted for councils of cities holding county rights | 0 |
| Number of lists registered for communal councils | 4 |
| Totalling | 4 |
Submitted candidates
| Name | Number of candidates | Women | Women (%) | Men | Men (%) |
|---|---|---|---|---|---|
| Number of candidates submitted for county councils | 0 | 0 | - | 0 | - |
| Number of candidates submitted for councils of cities holding county rights | 0 | 0 | - | 0 | - |
| Number of candidates registered for communal councils | 39 | 6 | 15.38% | 33 | 84.62% |
| Number of candidates submitted for reeve, mayor and presidential elections | 1 | 1 | 100.00% | 0 | 0.00% |
| Totalling | 40 | 7 | 17.50% | 33 | 82.50% |
Average age of submitted candidates
| Name | Average age | Average age of women | Average age of men |
|---|---|---|---|
| Average age of candidates submitted for county councils | - | - | - |
| Average age of candidates for councils of cities holding county rights | - | - | - |
| Average age of candidates submitted for communal councils | 49 | 43 | 51 |
| Average age of candidates for reeve, mayor, president | 41 | 41 | - |
| Totalling | 49 | 42 | 51 |
Submitted candidates grouped by age
| Name | Number of candidates | Women | Women (%) | Men | Men (%) |
|---|---|---|---|---|---|
| 18-29 | 2 | 1 | 50.00% | 1 | 50.00% |
| 30-39 | 4 | 1 | 25.00% | 3 | 75.00% |
| 40-49 | 14 | 3 | 21.43% | 11 | 78.57% |
| 50-59 | 14 | 2 | 14.29% | 12 | 85.71% |
| 60-69 | 4 | 0 | 0.00% | 4 | 100.00% |
| 70+ | 2 | 0 | 0.00% | 2 | 100.00% |
The youngest and oldest candidate submitted
| Age | Institution | |
|---|---|---|
| Youngest | 28 | Rada Gminy Zabierzów |
| Oldest | 72 | Rada Gminy Zabierzów |