Komitet Wyborczy Ruch Autonomii Śląska
| Name: | Komitet Wyborczy Ruch Autonomii Śląska | |
| Short name: | KW Ruch Autonomii Śląska | |
| Type of committee: | Election committees established by organisations | |
| Address: | Plac Wolności 7, 44-200 Rybnik | |
| Plenipotentiary: | electoral | financial |
| Marek Marcisz | Leon Swaczyna | |
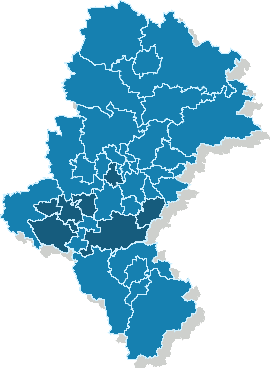
The provinces where the committee has submitted lists of candidates
| Name |
|---|
| m. Ruda Śląska |
| m. Rybnik |
| pow. bieruńsko-lędziński |
| pow. pszczyński |
| pow. rybnicki |
| pow. wodzisławski |
Sejmik Województwa Śląskiego
Submitted candidates
| Name | Number of candidates | Women | Women (%) | Men | Men (%) | Status |
|---|---|---|---|---|---|---|
| Sum: | 68 | 14 | 20.59% | 54 | 79.41% | |
| Constituency no. 1 | 5 | 0 | 0.00% | 5 | 100.00% |
|
| Constituency no. 2 | 13 | 2 | 15.38% | 11 | 84.62% |
|
| Constituency no. 3 | 14 | 2 | 14.29% | 12 | 85.71% |
|
| Constituency no. 4 | 12 | 6 | 50.00% | 6 | 50.00% |
|
| Constituency no. 5 | 14 | 2 | 14.29% | 12 | 85.71% |
|
| Constituency no. 6 | 5 | 1 | 20.00% | 4 | 80.00% |
|
| Constituency no. 7 | 5 | 1 | 20.00% | 4 | 80.00% |
|
Age of the candidates
| Name | Average age | Average age of women | Average age of men | Oldest | Youngest |
|---|---|---|---|---|---|
| Constituency no. 1 | 56 | 56 | 64 | 49 | |
| Constituency no. 2 | 39 | 47 | 38 | 64 | 23 |
| Constituency no. 3 | 45 | 45 | 45 | 67 | 20 |
| Constituency no. 4 | 42 | 52 | 33 | 76 | 23 |
| Constituency no. 5 | 37 | 28 | 39 | 52 | 25 |
| Constituency no. 6 | 55 | 81 | 49 | 81 | 41 |
| Constituency no. 7 | 40 | 34 | 42 | 58 | 32 |
The statistics of election committe
Lists submitted
| Description | Number of |
|---|---|
| Number of lists submitted for province council | 7 |
| Number of lists submitted for county councils | 5 |
| Number of lists submitted for councils of cities holding county rights | 5 |
| Number of lists registered for communal councils | 27 |
| Totalling | 44 |
Submitted candidates
| Name | Number of candidates | Women | Women (%) | Men | Men (%) |
|---|---|---|---|---|---|
| Number of candidates submitted for the province council | 68 | 14 | 20.59% | 54 | 79.41% |
| Number of candidates submitted for county councils | 34 | 9 | 26.47% | 25 | 73.53% |
| Number of candidates submitted for councils of cities holding county rights | 32 | 3 | 9.38% | 29 | 90.62% |
| Number of candidates registered for communal councils | 84 | 16 | 19.05% | 68 | 80.95% |
| Number of candidates submitted for reeve, mayor and presidential elections | 4 | 0 | 0.00% | 4 | 100.00% |
| Totalling | 222 | 42 | 18.92% | 180 | 81.08% |
Average age of submitted candidates
| Name | Average age | Average age of women | Average age of men |
|---|---|---|---|
| Average age of candidates submitted for the province council | 43 | 47 | 42 |
| Average age of candidates submitted for county councils | 43 | 45 | 42 |
| Average age of candidates for councils of cities holding county rights | 40 | 50 | 39 |
| Average age of candidates submitted for communal councils | 46 | 44 | 46 |
| Average age of candidates for reeve, mayor, president | 48 | - | 48 |
| Totalling | 44 | 46 | 43 |
Submitted candidates grouped by age
| Name | Number of candidates | Women | Women (%) | Men | Men (%) |
|---|---|---|---|---|---|
| 18-29 | 29 | 4 | 13.79% | 25 | 86.21% |
| 30-39 | 60 | 10 | 16.67% | 50 | 83.33% |
| 40-49 | 46 | 11 | 23.91% | 35 | 76.09% |
| 50-59 | 61 | 10 | 16.39% | 51 | 83.61% |
| 60-69 | 23 | 5 | 21.74% | 18 | 78.26% |
| 70+ | 3 | 2 | 66.67% | 1 | 33.33% |
The youngest and oldest candidate submitted
| Age | Institution | |
|---|---|---|
| Youngest | 20 | Rada Miejska w Czerwionce-Leszczynach |
| Oldest | 81 | Sejmik Województwa Śląskiego |