Komitet Wyborczy Chrześcijańskiego Ruchu Samorządowego
| Name: | Komitet Wyborczy Chrześcijańskiego Ruchu Samorządowego | |
| Short name: | KW Chrześcijańskiego Ruchu Samorządowego | |
| Type of committee: | Election committees established by organisations | |
| Address: | ul. Piotrkowska 133, 90-434 Łódź | |
| Plenipotentiary: | electoral | financial |
| Grzegorz Kaźmierczak | Grażyna Korasiewicz | |
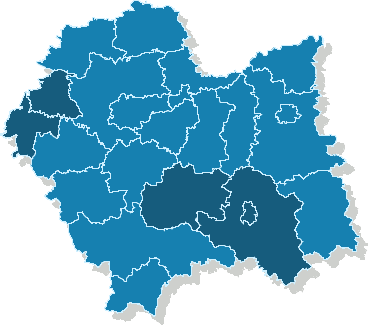
The provinces where the committee has submitted lists of candidates
| Name |
|---|
| m. Nowy Sącz |
| pow. chrzanowski |
| pow. limanowski |
| pow. nowosądecki |
| pow. oświęcimski |
Sejmik Województwa Małopolskiego
Submitted candidates
| Name | Number of candidates | Women | Women (%) | Men | Men (%) | Status |
|---|---|---|---|---|---|---|
| Sum: | 12 | 3 | 25.00% | 9 | 75.00% | |
| Constituency no. 6 | 12 | 3 | 25.00% | 9 | 75.00% |
|
Age of the candidates
| Name | Average age | Average age of women | Average age of men | Oldest | Youngest |
|---|---|---|---|---|---|
| Constituency no. 6 | 48 | 52 | 46 | 66 | 35 |
The statistics of election committe
Lists submitted
| Description | Number of |
|---|---|
| Number of lists submitted for province council | 1 |
| Number of lists submitted for county councils | 10 |
| Number of lists submitted for councils of cities holding county rights | 4 |
| Number of lists registered for communal councils | 32 |
| Totalling | 47 |
Submitted candidates
| Name | Number of candidates | Women | Women (%) | Men | Men (%) |
|---|---|---|---|---|---|
| Number of candidates submitted for the province council | 12 | 3 | 25.00% | 9 | 75.00% |
| Number of candidates submitted for county councils | 75 | 31 | 41.33% | 44 | 58.67% |
| Number of candidates submitted for councils of cities holding county rights | 44 | 7 | 15.91% | 37 | 84.09% |
| Number of candidates registered for communal councils | 169 | 52 | 30.77% | 117 | 69.23% |
| Number of candidates submitted for reeve, mayor and presidential elections | 6 | 1 | 16.67% | 5 | 83.33% |
| Totalling | 306 | 94 | 30.72% | 212 | 69.28% |
Average age of submitted candidates
| Name | Average age | Average age of women | Average age of men |
|---|---|---|---|
| Average age of candidates submitted for the province council | 48 | 52 | 46 |
| Average age of candidates submitted for county councils | 48 | 50 | 46 |
| Average age of candidates for councils of cities holding county rights | 45 | 53 | 44 |
| Average age of candidates submitted for communal councils | 44 | 42 | 44 |
| Average age of candidates for reeve, mayor, president | 46 | 43 | 46 |
| Totalling | 45 | 46 | 45 |
Submitted candidates grouped by age
| Name | Number of candidates | Women | Women (%) | Men | Men (%) |
|---|---|---|---|---|---|
| 18-29 | 33 | 8 | 24.24% | 25 | 75.76% |
| 30-39 | 59 | 14 | 23.73% | 45 | 76.27% |
| 40-49 | 94 | 32 | 34.04% | 62 | 65.96% |
| 50-59 | 89 | 34 | 38.20% | 55 | 61.80% |
| 60-69 | 25 | 5 | 20.00% | 20 | 80.00% |
| 70+ | 6 | 1 | 16.67% | 5 | 83.33% |
The youngest and oldest candidate submitted
| Age | Institution | |
|---|---|---|
| Youngest | 19 | Rada Miejska w Chrzanowie |
| Oldest | 76 | Rada Gminy w Kamienicy |