Komitet Wyborczy Polskiego Stronnictwa Ludowego
| Name: | Komitet Wyborczy Polskiego Stronnictwa Ludowego | |
| Short name: | Komitet Wyborczy PSL | |
| Type of committee: | Election committees established by political parties | |
| Address: | ul. Kopernika 36/40, 00-924 Warszawa | |
| Plenipotentiary: | electoral | financial |
| Józef Szczepańczyk | Henryk Cichecki | |
The provinces where the committee has submitted lists of candidates
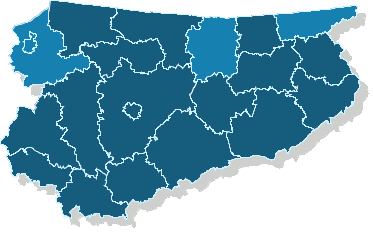
Sejmik Województwa Warmińsko-Mazurskiego
Submitted candidates
| Name | Number of candidates | Women | Women (%) | Men | Men (%) | Status |
|---|---|---|---|---|---|---|
| Sum: | 60 | 21 | 35.00% | 39 | 65.00% | |
| Constituency no. 1 | 12 | 4 | 33.33% | 8 | 66.67% |
|
| Constituency no. 2 | 12 | 6 | 50.00% | 6 | 50.00% |
|
| Constituency no. 3 | 14 | 4 | 28.57% | 10 | 71.43% |
|
| Constituency no. 4 | 10 | 3 | 30.00% | 7 | 70.00% |
|
| Constituency no. 5 | 12 | 4 | 33.33% | 8 | 66.67% |
|
Age of the candidates
| Name | Average age | Average age of women | Average age of men | Oldest | Youngest |
|---|---|---|---|---|---|
| Constituency no. 1 | 56 | 49 | 60 | 70 | 29 |
| Constituency no. 2 | 49 | 49 | 49 | 64 | 33 |
| Constituency no. 3 | 50 | 44 | 52 | 66 | 36 |
| Constituency no. 4 | 45 | 40 | 47 | 69 | 31 |
| Constituency no. 5 | 51 | 48 | 53 | 68 | 34 |
The statistics of election committe
Lists submitted
| Description | Number of |
|---|---|
| Number of lists submitted for province council | 5 |
| Number of lists submitted for county councils | 37 |
| Number of lists submitted for councils of cities holding county rights | 4 |
| Number of lists registered for communal councils | 332 |
| Totalling | 378 |
Submitted candidates
| Name | Number of candidates | Women | Women (%) | Men | Men (%) |
|---|---|---|---|---|---|
| Number of candidates submitted for the province council | 60 | 21 | 35.00% | 39 | 65.00% |
| Number of candidates submitted for county councils | 294 | 80 | 27.21% | 214 | 72.79% |
| Number of candidates submitted for councils of cities holding county rights | 25 | 11 | 44.00% | 14 | 56.00% |
| Number of candidates registered for communal councils | 519 | 148 | 28.52% | 371 | 71.48% |
| Number of candidates submitted for reeve, mayor and presidential elections | 23 | 6 | 26.09% | 17 | 73.91% |
| Totalling | 921 | 266 | 28.88% | 655 | 71.12% |
Average age of submitted candidates
| Name | Average age | Average age of women | Average age of men |
|---|---|---|---|
| Average age of candidates submitted for the province council | 50 | 46 | 52 |
| Average age of candidates submitted for county councils | 47 | 46 | 48 |
| Average age of candidates for councils of cities holding county rights | 47 | 43 | 50 |
| Average age of candidates submitted for communal councils | 46 | 46 | 46 |
| Average age of candidates for reeve, mayor, president | 50 | 50 | 49 |
| Totalling | 47 | 46 | 47 |
Submitted candidates grouped by age
| Name | Number of candidates | Women | Women (%) | Men | Men (%) |
|---|---|---|---|---|---|
| 18-29 | 68 | 12 | 17.65% | 56 | 82.35% |
| 30-39 | 140 | 50 | 35.71% | 90 | 64.29% |
| 40-49 | 307 | 98 | 31.92% | 209 | 68.08% |
| 50-59 | 305 | 84 | 27.54% | 221 | 72.46% |
| 60-69 | 92 | 22 | 23.91% | 70 | 76.09% |
| 70+ | 9 | 0 | 0.00% | 9 | 100.00% |
The youngest and oldest candidate submitted
| Age | Institution | |
|---|---|---|
| Youngest | 18 | Rada Miejska w Morągu |
| Oldest | 75 | Rada Miejska w Szczytnie |