Komitet Wyborczy Wyborców Łowicka Wspólnota Samorządowa
| Name: | Komitet Wyborczy Wyborców Łowicka Wspólnota Samorządowa | |
| Short name: | KWW Łowicka Wspólnota Samorządowa | |
| Type of committee: | Election committees established by electors | |
| Address: | ul. Starzyńskiego 2/4a/13, 99-400 Łowicz | |
| Plenipotentiary: | electoral | financial |
| Wojciech Marek Kolka | Jadwiga Wanda Tuka | |
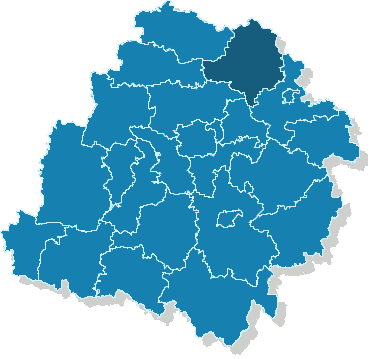
The provinces where the committee has submitted lists of candidates
| Name |
|---|
| pow. łowicki |
The statistics of election committe
Lists submitted
| Description | Number of |
|---|---|
| Number of lists submitted for province council | 0 |
| Number of lists submitted for county councils | 5 |
| Number of lists submitted for councils of cities holding county rights | 0 |
| Number of lists submitted for districts councils of the cap. city of Warsaw | 0 |
| Number of lists registered for communal councils | 3 |
| Totalling | 8 |
Submitted candidates
| Name | Number of candidates | Women | Women (%) | Men | Men (%) |
|---|---|---|---|---|---|
| Number of candidates submitted for the province council | 0 | 0 | - | 0 | - |
| Number of candidates submitted for county councils | 20 | 9 | 45.00% | 11 | 55.00% |
| Number of candidates submitted for councils of cities holding county rights | 0 | 0 | - | 0 | - |
| Number of candidates submitted for districts councils of the cap. city of Warsaw | 0 | 0 | - | 0 | - |
| Number of candidates registered for communal councils | 17 | 6 | 35.29% | 11 | 64.71% |
| Number of candidates submitted for reeve, mayor and presidential elections | 0 | 0 | - | 0 | - |
| Totalling | 37 | 15 | 40.54% | 22 | 59.46% |
Average age of submitted candidates
| Name | Average age | Average age of women | Average age of men |
|---|---|---|---|
| Average age of candidates submitted for the province council | - | - | - |
| Average age of candidates submitted for county councils | 43 | 42 | 44 |
| Average age of candidates for councils of cities holding county rights | - | - | - |
| Average age of candidates for districts councils of the cap. city of Warsaw | - | - | - |
| Average age of candidates submitted for communal councils | 45 | 35 | 50 |
| Average age of candidates for reeve, mayor, president | - | - | - |
| Totalling | 44 | 39 | 47 |
Submitted candidates grouped by age
| Name | Number of candidates | Women | Women (%) | Men | Men (%) |
|---|---|---|---|---|---|
| 18-29 | 7 | 5 | 71.43% | 2 | 28.57% |
| 30-39 | 5 | 3 | 60.00% | 2 | 40.00% |
| 40-49 | 12 | 3 | 25.00% | 9 | 75.00% |
| 50-59 | 8 | 2 | 25.00% | 6 | 75.00% |
| 60-69 | 5 | 2 | 40.00% | 3 | 60.00% |
| 70+ | 0 | 0 | — | 0 | — |
The youngest and oldest candidate submitted
| Age | Institution | |
|---|---|---|
| Youngest | 18 | Rada Miejska w Łowiczu |
| Oldest | 66 | Rada Powiatu Łowickiego |