Komitet Wyborczy OBYWATELSKIE FORUM SAMORZĄDOWE
| Name: | Komitet Wyborczy OBYWATELSKIE FORUM SAMORZĄDOWE | |
| Short name: | KW OBYWATELSKIE FORUM SAMORZĄDOWE | |
| Type of committee: | Election committees established by organisations | |
| Address: | 3-go Maja 3, 62-300 Września | |
| Plenipotentiary: | electoral | financial |
| Cyryl Maria Andrzejewski | Elżbieta Hofman-Wróbel | |
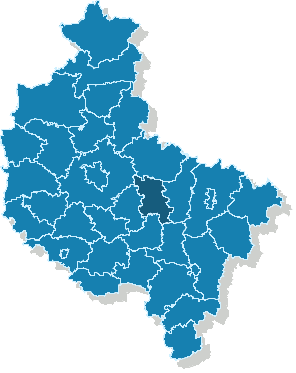
The provinces where the committee has submitted lists of candidates
| Name |
|---|
| pow. wrzesiński |
The statistics of election committe
Lists submitted
| Description | Number of |
|---|---|
| Number of lists submitted for province council | 0 |
| Number of lists submitted for county councils | 4 |
| Number of lists submitted for councils of cities holding county rights | 0 |
| Number of lists submitted for districts councils of the cap. city of Warsaw | 0 |
| Number of lists registered for communal councils | 10 |
| Totalling | 14 |
Submitted candidates
| Name | Number of candidates | Women | Women (%) | Men | Men (%) |
|---|---|---|---|---|---|
| Number of candidates submitted for the province council | 0 | 0 | - | 0 | - |
| Number of candidates submitted for county councils | 38 | 9 | 23.68% | 29 | 76.32% |
| Number of candidates submitted for councils of cities holding county rights | 0 | 0 | - | 0 | - |
| Number of candidates submitted for districts councils of the cap. city of Warsaw | 0 | 0 | - | 0 | - |
| Number of candidates registered for communal councils | 53 | 21 | 39.62% | 32 | 60.38% |
| Number of candidates submitted for reeve, mayor and presidential elections | 2 | 0 | 0.00% | 2 | 100.00% |
| Totalling | 93 | 30 | 32.26% | 63 | 67.74% |
Average age of submitted candidates
| Name | Average age | Average age of women | Average age of men |
|---|---|---|---|
| Average age of candidates submitted for the province council | - | - | - |
| Average age of candidates submitted for county councils | 51 | 50 | 51 |
| Average age of candidates for councils of cities holding county rights | - | - | - |
| Average age of candidates for districts councils of the cap. city of Warsaw | - | - | - |
| Average age of candidates submitted for communal councils | 47 | 42 | 50 |
| Average age of candidates for reeve, mayor, president | 54 | - | 54 |
| Totalling | 49 | 44 | 50 |
Submitted candidates grouped by age
| Name | Number of candidates | Women | Women (%) | Men | Men (%) |
|---|---|---|---|---|---|
| 18-29 | 6 | 4 | 66.67% | 2 | 33.33% |
| 30-39 | 15 | 6 | 40.00% | 9 | 60.00% |
| 40-49 | 23 | 10 | 43.48% | 13 | 56.52% |
| 50-59 | 35 | 8 | 22.86% | 27 | 77.14% |
| 60-69 | 10 | 2 | 20.00% | 8 | 80.00% |
| 70+ | 4 | 0 | 0.00% | 4 | 100.00% |
The youngest and oldest candidate submitted
| Age | Institution | |
|---|---|---|
| Youngest | 24 | Rada Miejska we Wrześni |
| Oldest | 80 | Rada Miejska we Wrześni |