Komitet Wyborczy WSPÓLNOTA TERYTORIALNA
| Name: | Komitet Wyborczy WSPÓLNOTA TERYTORIALNA | |
| Short name: | KW WSPÓLNOTA TERYTORIALNA | |
| Type of committee: | Election committees established by organisations | |
| Address: | ul. Kołłątaja 20 Olsztyn | |
| Plenipotentiary: | electoral | financial |
| Andrzej Ołtuszewski | Bartosz Gajownik | |
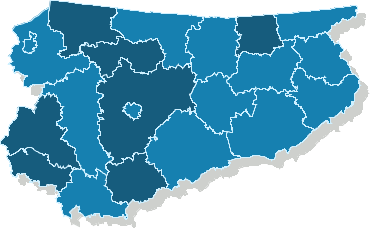
The provinces where the committee has submitted lists of candidates
| Name |
|---|
| pow. braniewski |
| pow. iławski |
| pow. lidzbarski |
| pow. nidzicki |
| pow. nowomiejski |
| pow. olsztyński |
| pow. węgorzewski |
The statistics of election committe
Lists submitted
| Description | Number of |
|---|---|
| Number of lists submitted for province council | 0 |
| Number of lists submitted for county councils | 12 |
| Number of lists submitted for councils of cities holding county rights | 0 |
| Number of lists submitted for districts councils of the cap. city of Warsaw | 0 |
| Number of lists registered for communal councils | 93 |
| Totalling | 105 |
Submitted candidates
| Name | Number of candidates | Women | Women (%) | Men | Men (%) |
|---|---|---|---|---|---|
| Number of candidates submitted for the province council | 0 | 0 | - | 0 | - |
| Number of candidates submitted for county councils | 76 | 16 | 21.05% | 60 | 78.95% |
| Number of candidates submitted for councils of cities holding county rights | 0 | 0 | - | 0 | - |
| Number of candidates submitted for districts councils of the cap. city of Warsaw | 0 | 0 | - | 0 | - |
| Number of candidates registered for communal councils | 157 | 48 | 30.57% | 109 | 69.43% |
| Number of candidates submitted for reeve, mayor and presidential elections | 7 | 2 | 28.57% | 5 | 71.43% |
| Totalling | 240 | 66 | 27.50% | 174 | 72.50% |
Average age of submitted candidates
| Name | Average age | Average age of women | Average age of men |
|---|---|---|---|
| Average age of candidates submitted for the province council | - | - | - |
| Average age of candidates submitted for county councils | 49 | 48 | 49 |
| Average age of candidates for councils of cities holding county rights | - | - | - |
| Average age of candidates for districts councils of the cap. city of Warsaw | - | - | - |
| Average age of candidates submitted for communal councils | 46 | 43 | 47 |
| Average age of candidates for reeve, mayor, president | 54 | 58 | 52 |
| Totalling | 47 | 45 | 48 |
Submitted candidates grouped by age
| Name | Number of candidates | Women | Women (%) | Men | Men (%) |
|---|---|---|---|---|---|
| 18-29 | 18 | 6 | 33.33% | 12 | 66.67% |
| 30-39 | 39 | 11 | 28.21% | 28 | 71.79% |
| 40-49 | 67 | 23 | 34.33% | 44 | 65.67% |
| 50-59 | 92 | 22 | 23.91% | 70 | 76.09% |
| 60-69 | 20 | 3 | 15.00% | 17 | 85.00% |
| 70+ | 4 | 1 | 25.00% | 3 | 75.00% |
The youngest and oldest candidate submitted
| Age | Institution | |
|---|---|---|
| Youngest | 18 | Rada Miejska w Iławie |
| Oldest | 71 | Rada Miejska w Iławie |