Komitet Wyborczy Wyborców Lokalny Samorząd Mieszkańców
| Name: | Komitet Wyborczy Wyborców Lokalny Samorząd Mieszkańców | |
| Short name: | KWW Lokalny Samorząd Mieszkańców | |
| Type of committee: | Election committees established by electors | |
| Address: | ul. Żeromskiego 39, 26-700 Zwoleń | |
| Plenipotentiary: | electoral | financial |
| Edward Rybak | Teresa Binias | |
The provinces where the committee has submitted lists of candidates
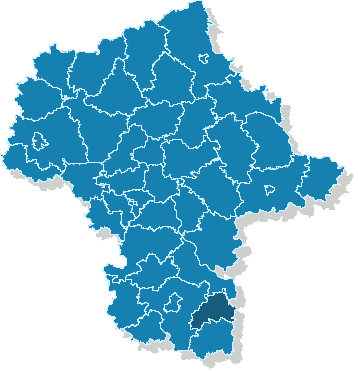
| Name |
|---|
| pow. zwoleński |
The statistics of election committe
Lists submitted
| Description | Number of |
|---|---|
| Number of lists submitted for province council | 0 |
| Number of lists submitted for county councils | 3 |
| Number of lists submitted for councils of cities holding county rights | 0 |
| Number of lists submitted for districts councils of the cap. city of Warsaw | 0 |
| Number of lists registered for communal councils | 16 |
| Totalling | 19 |
Submitted candidates
| Name | Number of candidates | Women | Women (%) | Men | Men (%) |
|---|---|---|---|---|---|
| Number of candidates submitted for the province council | 0 | 0 | - | 0 | - |
| Number of candidates submitted for county councils | 29 | 8 | 27.59% | 21 | 72.41% |
| Number of candidates submitted for councils of cities holding county rights | 0 | 0 | - | 0 | - |
| Number of candidates submitted for districts councils of the cap. city of Warsaw | 0 | 0 | - | 0 | - |
| Number of candidates registered for communal councils | 26 | 7 | 26.92% | 19 | 73.08% |
| Number of candidates submitted for reeve, mayor and presidential elections | 2 | 0 | 0.00% | 2 | 100.00% |
| Totalling | 57 | 15 | 26.32% | 42 | 73.68% |
Average age of submitted candidates
| Name | Average age | Average age of women | Average age of men |
|---|---|---|---|
| Average age of candidates submitted for the province council | - | - | - |
| Average age of candidates submitted for county councils | 47 | 45 | 48 |
| Average age of candidates for councils of cities holding county rights | - | - | - |
| Average age of candidates for districts councils of the cap. city of Warsaw | - | - | - |
| Average age of candidates submitted for communal councils | 46 | 43 | 47 |
| Average age of candidates for reeve, mayor, president | 54 | - | 54 |
| Totalling | 47 | 44 | 47 |
Submitted candidates grouped by age
| Name | Number of candidates | Women | Women (%) | Men | Men (%) |
|---|---|---|---|---|---|
| 18-29 | 1 | 0 | 0.00% | 1 | 100.00% |
| 30-39 | 10 | 3 | 30.00% | 7 | 70.00% |
| 40-49 | 25 | 7 | 28.00% | 18 | 72.00% |
| 50-59 | 17 | 5 | 29.41% | 12 | 70.59% |
| 60-69 | 3 | 0 | 0.00% | 3 | 100.00% |
| 70+ | 1 | 0 | 0.00% | 1 | 100.00% |
The youngest and oldest candidate submitted
| Age | Institution | |
|---|---|---|
| Youngest | 29 | Rada Gminy w Policznie |
| Oldest | 78 | Rada Gminy w Policznie |