Koalicyjny Komitet Wyborczy SLD+SDPL+PD+UP Lewica i Demokraci
| Name: | Koalicyjny Komitet Wyborczy SLD+SDPL+PD+UP Lewica i Demokraci | |
| Short name: | KKW SLD+SDPL+PD+UP Lewica i Demokraci | |
| Type of committee: | Election committees established by coalitions | |
| Address: | ul. Rozbrat 44a, 00-419 Warszawa | |
| Plenipotentiary: | electoral | financial |
| Michał Tober | Edward Kuczera | |
The provinces where the committee has submitted lists of candidates
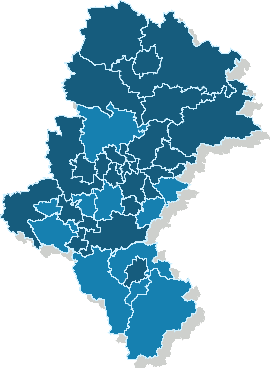
Sejmik Województwa Śląskiego
Submitted candidates
| Name | Number of candidates | Women | Women (%) | Men | Men (%) | Status |
|---|---|---|---|---|---|---|
| Sum: | 68 | 16 | 23.53% | 52 | 76.47% | |
| Constituency no. 1 | 9 | 4 | 44.44% | 5 | 55.56% |
|
| Constituency no. 2 | 12 | 1 | 8.33% | 11 | 91.67% |
|
| Constituency no. 3 | 9 | 3 | 33.33% | 6 | 66.67% |
|
| Constituency no. 4 | 8 | 1 | 12.50% | 7 | 87.50% |
|
| Constituency no. 5 | 8 | 1 | 12.50% | 7 | 87.50% |
|
| Constituency no. 6 | 10 | 2 | 20.00% | 8 | 80.00% |
|
| Constituency no. 7 | 12 | 4 | 33.33% | 8 | 66.67% |
|
Age of the candidates
| Name | Average age | Average age of women | Average age of men | Oldest | Youngest |
|---|---|---|---|---|---|
| Constituency no. 1 | 44 | 40 | 48 | 60 | 29 |
| Constituency no. 2 | 49 | 43 | 49 | 66 | 30 |
| Constituency no. 3 | 50 | 50 | 50 | 64 | 34 |
| Constituency no. 4 | 47 | 46 | 47 | 60 | 28 |
| Constituency no. 5 | 48 | 32 | 50 | 67 | 32 |
| Constituency no. 6 | 49 | 41 | 51 | 63 | 26 |
| Constituency no. 7 | 50 | 51 | 50 | 61 | 25 |
The statistics of election committe
Lists submitted
| Description | Number of |
|---|---|
| Number of lists submitted for province council | 7 |
| Number of lists submitted for county councils | 37 |
| Number of lists submitted for councils of cities holding county rights | 76 |
| Number of lists registered for communal councils | 149 |
| Totalling | 269 |
Submitted candidates
| Name | Number of candidates | Women | Women (%) | Men | Men (%) |
|---|---|---|---|---|---|
| Number of candidates submitted for the province council | 68 | 16 | 23.53% | 52 | 76.47% |
| Number of candidates submitted for county councils | 251 | 61 | 24.30% | 190 | 75.70% |
| Number of candidates submitted for councils of cities holding county rights | 772 | 193 | 25.00% | 579 | 75.00% |
| Number of candidates registered for communal councils | 428 | 134 | 31.31% | 294 | 68.69% |
| Number of candidates submitted for reeve, mayor and presidential elections | 27 | 3 | 11.11% | 24 | 88.89% |
| Totalling | 1,546 | 407 | 26.33% | 1,139 | 73.67% |
Average age of submitted candidates
| Name | Average age | Average age of women | Average age of men |
|---|---|---|---|
| Average age of candidates submitted for the province council | 48 | 44 | 49 |
| Average age of candidates submitted for county councils | 49 | 48 | 50 |
| Average age of candidates for councils of cities holding county rights | 46 | 45 | 46 |
| Average age of candidates submitted for communal councils | 47 | 46 | 47 |
| Average age of candidates for reeve, mayor, president | 49 | 52 | 49 |
| Totalling | 47 | 46 | 47 |
Submitted candidates grouped by age
| Name | Number of candidates | Women | Women (%) | Men | Men (%) |
|---|---|---|---|---|---|
| 18-29 | 201 | 50 | 24.88% | 151 | 75.12% |
| 30-39 | 249 | 71 | 28.51% | 178 | 71.49% |
| 40-49 | 310 | 97 | 31.29% | 213 | 68.71% |
| 50-59 | 527 | 145 | 27.51% | 382 | 72.49% |
| 60-69 | 230 | 40 | 17.39% | 190 | 82.61% |
| 70+ | 29 | 4 | 13.79% | 25 | 86.21% |
The youngest and oldest candidate submitted
| Age | Institution | |
|---|---|---|
| Youngest | 18 | Rada Miasta Częstochowy |
| Oldest | 84 | Rada Miasta Knurów |