Komitet Wyborczy Wyborców NASZA GMINA NASZYM DOMEM - OBWODNICA
| Name: | Komitet Wyborczy Wyborców NASZA GMINA NASZYM DOMEM - OBWODNICA | |
| Short name: | KWW NASZA GMINA NASZYM DOMEM - OBWODNICA | |
| Type of committee: | Election committees established by electors | |
| Address: | ul. Paderewskiego 34, 63-910 Miejska Górka | |
| Plenipotentiary: | electoral | financial |
| Krzysztof Franciszek Przybył | Ewa Alina Wojciechowska | |
The provinces where the committee has submitted lists of candidates
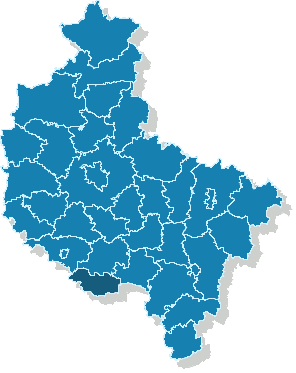
| Name |
|---|
| pow. rawicki |
The statistics of election committe
Lists submitted
| Description | Number of |
|---|---|
| Number of lists submitted for province council | 0 |
| Number of lists submitted for county councils | 1 |
| Number of lists submitted for councils of cities holding county rights | 0 |
| Number of lists submitted for districts councils of the cap. city of Warsaw | 0 |
| Number of lists registered for communal councils | 6 |
| Totalling | 7 |
Submitted candidates
| Name | Number of candidates | Women | Women (%) | Men | Men (%) |
|---|---|---|---|---|---|
| Number of candidates submitted for the province council | 0 | 0 | - | 0 | - |
| Number of candidates submitted for county councils | 3 | 0 | 0.00% | 3 | 100.00% |
| Number of candidates submitted for councils of cities holding county rights | 0 | 0 | - | 0 | - |
| Number of candidates submitted for districts councils of the cap. city of Warsaw | 0 | 0 | - | 0 | - |
| Number of candidates registered for communal councils | 7 | 3 | 42.86% | 4 | 57.14% |
| Number of candidates submitted for reeve, mayor and presidential elections | 1 | 0 | 0.00% | 1 | 100.00% |
| Totalling | 11 | 3 | 27.27% | 8 | 72.73% |
Average age of submitted candidates
| Name | Average age | Average age of women | Average age of men |
|---|---|---|---|
| Average age of candidates submitted for the province council | - | - | - |
| Average age of candidates submitted for county councils | 53 | - | 53 |
| Average age of candidates for councils of cities holding county rights | - | - | - |
| Average age of candidates for districts councils of the cap. city of Warsaw | - | - | - |
| Average age of candidates submitted for communal councils | 41 | 40 | 42 |
| Average age of candidates for reeve, mayor, president | 47 | - | 47 |
| Totalling | 45 | 40 | 47 |
Submitted candidates grouped by age
| Name | Number of candidates | Women | Women (%) | Men | Men (%) |
|---|---|---|---|---|---|
| 18-29 | 0 | 0 | — | 0 | — |
| 30-39 | 3 | 2 | 66.67% | 1 | 33.33% |
| 40-49 | 5 | 0 | 0.00% | 5 | 100.00% |
| 50-59 | 3 | 1 | 33.33% | 2 | 66.67% |
| 60-69 | 0 | 0 | — | 0 | — |
| 70+ | 0 | 0 | — | 0 | — |
The youngest and oldest candidate submitted
| Age | Institution | |
|---|---|---|
| Youngest | 30 | Rada Miejska w Miejskiej Górce |
| Oldest | 58 | Rada Powiatu Rawickiego |