Komitet Wyborczy Wyborców Demokracja i Samorządność
| Name: | Komitet Wyborczy Wyborców Demokracja i Samorządność | |
| Short name: | KWW Demokracja i Samorządność | |
| Type of committee: | Election committees established by electors | |
| Address: | Os. XXX-lecia PRL 18/10, 44-300 Wodzisław Śląski | |
| Plenipotentiary: | electoral | financial |
| Roman Kwaśny | Zofia Rzewucka-Wojda | |
The provinces where the committee has submitted lists of candidates
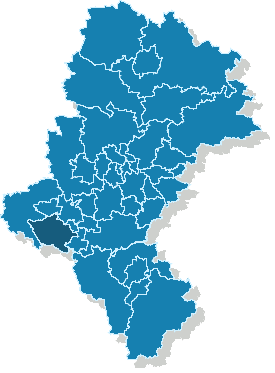
| Name |
|---|
| pow. wodzisławski |
The statistics of election committe
Lists submitted
| Description | Number of |
|---|---|
| Number of lists submitted for province council | 0 |
| Number of lists submitted for county councils | 5 |
| Number of lists submitted for councils of cities holding county rights | 0 |
| Number of lists submitted for districts councils of the cap. city of Warsaw | 0 |
| Number of lists registered for communal councils | 15 |
| Totalling | 20 |
Submitted candidates
| Name | Number of candidates | Women | Women (%) | Men | Men (%) |
|---|---|---|---|---|---|
| Number of candidates submitted for the province council | 0 | 0 | - | 0 | - |
| Number of candidates submitted for county councils | 42 | 11 | 26.19% | 31 | 73.81% |
| Number of candidates submitted for councils of cities holding county rights | 0 | 0 | - | 0 | - |
| Number of candidates submitted for districts councils of the cap. city of Warsaw | 0 | 0 | - | 0 | - |
| Number of candidates registered for communal councils | 93 | 30 | 32.26% | 63 | 67.74% |
| Number of candidates submitted for reeve, mayor and presidential elections | 2 | 0 | 0.00% | 2 | 100.00% |
| Totalling | 137 | 41 | 29.93% | 96 | 70.07% |
Average age of submitted candidates
| Name | Average age | Average age of women | Average age of men |
|---|---|---|---|
| Average age of candidates submitted for the province council | - | - | - |
| Average age of candidates submitted for county councils | 49 | 47 | 50 |
| Average age of candidates for councils of cities holding county rights | - | - | - |
| Average age of candidates for districts councils of the cap. city of Warsaw | - | - | - |
| Average age of candidates submitted for communal councils | 46 | 42 | 47 |
| Average age of candidates for reeve, mayor, president | 56 | - | 56 |
| Totalling | 47 | 43 | 48 |
Submitted candidates grouped by age
| Name | Number of candidates | Women | Women (%) | Men | Men (%) |
|---|---|---|---|---|---|
| 18-29 | 9 | 3 | 33.33% | 6 | 66.67% |
| 30-39 | 29 | 14 | 48.28% | 15 | 51.72% |
| 40-49 | 28 | 9 | 32.14% | 19 | 67.86% |
| 50-59 | 55 | 11 | 20.00% | 44 | 80.00% |
| 60-69 | 16 | 4 | 25.00% | 12 | 75.00% |
| 70+ | 0 | 0 | — | 0 | — |
The youngest and oldest candidate submitted
| Age | Institution | |
|---|---|---|
| Youngest | 23 | Rada Miasta Rydułtowy |
| Oldest | 68 | Rada Miejska Wodzisławia Śląskiego |