Komitet Wyborczy Liga Polskich Rodzin
| Name: | Komitet Wyborczy Liga Polskich Rodzin | |
| Short name: | KW Liga Polskich Rodzin | |
| Type of committee: | Election committees established by political parties | |
| Address: | ul. Hoża 9, 00-528 Warszawa | |
| Plenipotentiary: | electoral | financial |
| Paweł Adam Sulowski | Marta Barbara Zanin | |
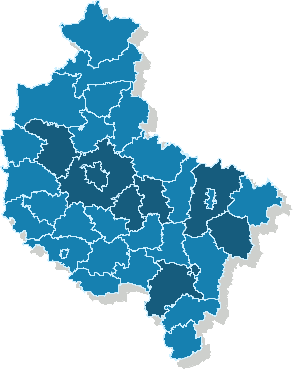
The provinces where the committee has submitted lists of candidates
| Name |
|---|
| m. Kalisz |
| m. Poznań |
| pow. koniński |
| pow. ostrowski |
| pow. poznański |
| pow. szamotulski |
| pow. średzki |
| pow. turecki |
| pow. wrzesiński |
Sejmik Województwa Wielkopolskiego
Submitted candidates
| Name | Number of candidates | Women | Women (%) | Men | Men (%) | Status |
|---|---|---|---|---|---|---|
| Sum: | 76 | 24 | 31.58% | 52 | 68.42% | |
| Constituency no. 1 | 12 | 7 | 58.33% | 5 | 41.67% |
|
| Constituency no. 2 | 13 | 6 | 46.15% | 7 | 53.85% |
|
| Constituency no. 3 | 14 | 3 | 21.43% | 11 | 78.57% |
|
| Constituency no. 4 | 9 | 1 | 11.11% | 8 | 88.89% |
|
| Constituency no. 5 | 14 | 3 | 21.43% | 11 | 78.57% |
|
| Constituency no. 6 | 14 | 4 | 28.57% | 10 | 71.43% |
|
Age of the candidates
| Name | Average age | Average age of women | Average age of men | Oldest | Youngest |
|---|---|---|---|---|---|
| Constituency no. 1 | 42 | 48 | 35 | 65 | 18 |
| Constituency no. 2 | 39 | 45 | 34 | 74 | 20 |
| Constituency no. 3 | 37 | 39 | 37 | 68 | 22 |
| Constituency no. 4 | 46 | 43 | 46 | 68 | 24 |
| Constituency no. 5 | 33 | 34 | 33 | 59 | 19 |
| Constituency no. 6 | 36 | 46 | 32 | 61 | 19 |
The statistics of election committe
Lists submitted
| Description | Number of |
|---|---|
| Number of lists submitted for province council | 6 |
| Number of lists submitted for county councils | 15 |
| Number of lists submitted for councils of cities holding county rights | 12 |
| Number of lists registered for communal councils | 32 |
| Totalling | 65 |
Submitted candidates
| Name | Number of candidates | Women | Women (%) | Men | Men (%) |
|---|---|---|---|---|---|
| Number of candidates submitted for the province council | 76 | 24 | 31.58% | 52 | 68.42% |
| Number of candidates submitted for county councils | 115 | 43 | 37.39% | 72 | 62.61% |
| Number of candidates submitted for councils of cities holding county rights | 81 | 45 | 55.56% | 36 | 44.44% |
| Number of candidates registered for communal councils | 42 | 12 | 28.57% | 30 | 71.43% |
| Number of candidates submitted for reeve, mayor and presidential elections | 3 | 0 | 0.00% | 3 | 100.00% |
| Totalling | 317 | 124 | 39.12% | 193 | 60.88% |
Average age of submitted candidates
| Name | Average age | Average age of women | Average age of men |
|---|---|---|---|
| Average age of candidates submitted for the province council | 38 | 44 | 36 |
| Average age of candidates submitted for county councils | 44 | 42 | 45 |
| Average age of candidates for councils of cities holding county rights | 50 | 51 | 48 |
| Average age of candidates submitted for communal councils | 44 | 43 | 44 |
| Average age of candidates for reeve, mayor, president | 48 | - | 48 |
| Totalling | 44 | 46 | 43 |
Submitted candidates grouped by age
| Name | Number of candidates | Women | Women (%) | Men | Men (%) |
|---|---|---|---|---|---|
| 18-29 | 83 | 28 | 33.73% | 55 | 66.27% |
| 30-39 | 39 | 13 | 33.33% | 26 | 66.67% |
| 40-49 | 62 | 22 | 35.48% | 40 | 64.52% |
| 50-59 | 78 | 37 | 47.44% | 41 | 52.56% |
| 60-69 | 37 | 18 | 48.65% | 19 | 51.35% |
| 70+ | 18 | 6 | 33.33% | 12 | 66.67% |
The youngest and oldest candidate submitted
| Age | Institution | |
|---|---|---|
| Youngest | 18 | Rada Miasta Poznania |
| Oldest | 84 | Rada Miasta Poznania |