Komitet Wyborczy Stowarzyszenia Wspólnota Samorządowa - Gryf
| Name: | Komitet Wyborczy Stowarzyszenia Wspólnota Samorządowa - Gryf | |
| Short name: | KW Gryf | |
| Type of committee: | Election committees established by organisations | |
| Address: | ul. Bankowa 11/13, 72-010 Police | |
| Plenipotentiary: | electoral | financial |
| Grzegorz Marek Ufniarz | Zbigniew Wyrwicz | |
The provinces where the committee has submitted lists of candidates
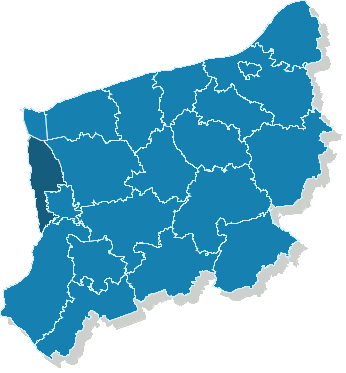
| Name |
|---|
| pow. policki |
The statistics of election committe
Lists submitted
| Description | Number of |
|---|---|
| Number of lists submitted for province council | 0 |
| Number of lists submitted for county councils | 5 |
| Number of lists submitted for councils of cities holding county rights | 0 |
| Number of lists submitted for districts councils of the cap. city of Warsaw | 0 |
| Number of lists registered for communal councils | 3 |
| Totalling | 8 |
Submitted candidates
| Name | Number of candidates | Women | Women (%) | Men | Men (%) |
|---|---|---|---|---|---|
| Number of candidates submitted for the province council | 0 | 0 | - | 0 | - |
| Number of candidates submitted for county councils | 29 | 6 | 20.69% | 23 | 79.31% |
| Number of candidates submitted for councils of cities holding county rights | 0 | 0 | - | 0 | - |
| Number of candidates submitted for districts councils of the cap. city of Warsaw | 0 | 0 | - | 0 | - |
| Number of candidates registered for communal councils | 35 | 7 | 20.00% | 28 | 80.00% |
| Number of candidates submitted for reeve, mayor and presidential elections | 1 | 0 | 0.00% | 1 | 100.00% |
| Totalling | 65 | 13 | 20.00% | 52 | 80.00% |
Average age of submitted candidates
| Name | Average age | Average age of women | Average age of men |
|---|---|---|---|
| Average age of candidates submitted for the province council | - | - | - |
| Average age of candidates submitted for county councils | 49 | 47 | 49 |
| Average age of candidates for councils of cities holding county rights | - | - | - |
| Average age of candidates for districts councils of the cap. city of Warsaw | - | - | - |
| Average age of candidates submitted for communal councils | 44 | 53 | 42 |
| Average age of candidates for reeve, mayor, president | 57 | - | 57 |
| Totalling | 46 | 50 | 45 |
Submitted candidates grouped by age
| Name | Number of candidates | Women | Women (%) | Men | Men (%) |
|---|---|---|---|---|---|
| 18-29 | 9 | 1 | 11.11% | 8 | 88.89% |
| 30-39 | 8 | 1 | 12.50% | 7 | 87.50% |
| 40-49 | 19 | 4 | 21.05% | 15 | 78.95% |
| 50-59 | 23 | 6 | 26.09% | 17 | 73.91% |
| 60-69 | 5 | 1 | 20.00% | 4 | 80.00% |
| 70+ | 1 | 0 | 0.00% | 1 | 100.00% |
The youngest and oldest candidate submitted
| Age | Institution | |
|---|---|---|
| Youngest | 21 | Rada Miejska w Policach |
| Oldest | 75 | Rada Powiatu Polickiego |