Komitet Wyborczy "POROZUMIENIE GORLICKIE"
| Name: | Komitet Wyborczy "POROZUMIENIE GORLICKIE" | |
| Short name: | KW POROZUMIENIE GORLICKIE | |
| Type of committee: | Election committees established by organisations | |
| Address: | ul. Wróblewskiego 10, 38-300 Gorlice | |
| Plenipotentiary: | electoral | financial |
| Piotr Krzysztof Śliwa | Lidia Filar | |
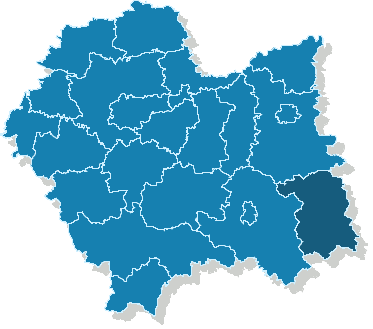
The provinces where the committee has submitted lists of candidates
| Name |
|---|
| pow. gorlicki |
The statistics of election committe
Lists submitted
| Description | Number of |
|---|---|
| Number of lists submitted for province council | 0 |
| Number of lists submitted for county councils | 5 |
| Number of lists submitted for councils of cities holding county rights | 0 |
| Number of lists submitted for districts councils of the cap. city of Warsaw | 0 |
| Number of lists registered for communal councils | 4 |
| Totalling | 9 |
Submitted candidates
| Name | Number of candidates | Women | Women (%) | Men | Men (%) |
|---|---|---|---|---|---|
| Number of candidates submitted for the province council | 0 | 0 | - | 0 | - |
| Number of candidates submitted for county councils | 32 | 12 | 37.50% | 20 | 62.50% |
| Number of candidates submitted for councils of cities holding county rights | 0 | 0 | - | 0 | - |
| Number of candidates submitted for districts councils of the cap. city of Warsaw | 0 | 0 | - | 0 | - |
| Number of candidates registered for communal councils | 31 | 11 | 35.48% | 20 | 64.52% |
| Number of candidates submitted for reeve, mayor and presidential elections | 1 | 1 | 100.00% | 0 | 0.00% |
| Totalling | 64 | 24 | 37.50% | 40 | 62.50% |
Average age of submitted candidates
| Name | Average age | Average age of women | Average age of men |
|---|---|---|---|
| Average age of candidates submitted for the province council | - | - | - |
| Average age of candidates submitted for county councils | 39 | 42 | 38 |
| Average age of candidates for councils of cities holding county rights | - | - | - |
| Average age of candidates for districts councils of the cap. city of Warsaw | - | - | - |
| Average age of candidates submitted for communal councils | 45 | 45 | 44 |
| Average age of candidates for reeve, mayor, president | 44 | 44 | - |
| Totalling | 42 | 43 | 41 |
Submitted candidates grouped by age
| Name | Number of candidates | Women | Women (%) | Men | Men (%) |
|---|---|---|---|---|---|
| 18-29 | 12 | 2 | 16.67% | 10 | 83.33% |
| 30-39 | 12 | 5 | 41.67% | 7 | 58.33% |
| 40-49 | 20 | 10 | 50.00% | 10 | 50.00% |
| 50-59 | 16 | 5 | 31.25% | 11 | 68.75% |
| 60-69 | 4 | 2 | 50.00% | 2 | 50.00% |
| 70+ | 0 | 0 | — | 0 | — |
The youngest and oldest candidate submitted
| Age | Institution | |
|---|---|---|
| Youngest | 19 | Rada Powiatu Gorlickiego |
| Oldest | 67 | Rada Powiatu Gorlickiego |