Komitet Wyborczy Wyborców "Szansa dla Śląska"
| Name: | Komitet Wyborczy Wyborców "Szansa dla Śląska" | |
| Short name: | KWW "Szansa dla Śląska" | |
| Type of committee: | Election committees established by electors | |
| Address: | ul. Rolników 63 , 44-141 Gliwice | |
| Plenipotentiary: | electoral | financial |
| Kazimierz Wacław Jankiewicz | Katarzyna Maria Kalisz | |
The provinces where the committee has submitted lists of candidates
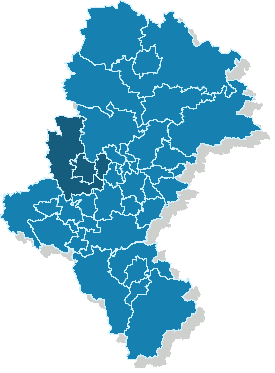
| Name |
|---|
| m. Gliwice |
| m. Zabrze |
| pow. gliwicki |
The statistics of election committe
Lists submitted
| Description | Number of |
|---|---|
| Number of lists submitted for province council | 0 |
| Number of lists submitted for county councils | 0 |
| Number of lists submitted for councils of cities holding county rights | 4 |
| Number of lists submitted for districts councils of the cap. city of Warsaw | 0 |
| Number of lists registered for communal councils | 4 |
| Totalling | 8 |
Submitted candidates
| Name | Number of candidates | Women | Women (%) | Men | Men (%) |
|---|---|---|---|---|---|
| Number of candidates submitted for the province council | 0 | 0 | - | 0 | - |
| Number of candidates submitted for county councils | 0 | 0 | - | 0 | - |
| Number of candidates submitted for councils of cities holding county rights | 25 | 6 | 24.00% | 19 | 76.00% |
| Number of candidates submitted for districts councils of the cap. city of Warsaw | 0 | 0 | - | 0 | - |
| Number of candidates registered for communal councils | 6 | 0 | 0.00% | 6 | 100.00% |
| Number of candidates submitted for reeve, mayor and presidential elections | 1 | 0 | 0.00% | 1 | 100.00% |
| Totalling | 32 | 6 | 18.75% | 26 | 81.25% |
Average age of submitted candidates
| Name | Average age | Average age of women | Average age of men |
|---|---|---|---|
| Average age of candidates submitted for the province council | - | - | - |
| Average age of candidates submitted for county councils | - | - | - |
| Average age of candidates for councils of cities holding county rights | 38 | 38 | 39 |
| Average age of candidates for districts councils of the cap. city of Warsaw | - | - | - |
| Average age of candidates submitted for communal councils | 43 | - | 43 |
| Average age of candidates for reeve, mayor, president | 49 | - | 49 |
| Totalling | 40 | 38 | 40 |
Submitted candidates grouped by age
| Name | Number of candidates | Women | Women (%) | Men | Men (%) |
|---|---|---|---|---|---|
| 18-29 | 9 | 2 | 22.22% | 7 | 77.78% |
| 30-39 | 3 | 0 | 0.00% | 3 | 100.00% |
| 40-49 | 14 | 3 | 21.43% | 11 | 78.57% |
| 50-59 | 4 | 1 | 25.00% | 3 | 75.00% |
| 60-69 | 1 | 0 | 0.00% | 1 | 100.00% |
| 70+ | 1 | 0 | 0.00% | 1 | 100.00% |
The youngest and oldest candidate submitted
| Age | Institution | |
|---|---|---|
| Youngest | 18 | Rada Miejska w Gliwicach |
| Oldest | 79 | Rada Miejska w Gliwicach |