Komitet Wyborczy Wyborców Opolskiej Spółdzielni Mieszkaniowej "Przyszłość" w Opolu
| Name: | Komitet Wyborczy Wyborców Opolskiej Spółdzielni Mieszkaniowej "Przyszłość" w Opolu | |
| Short name: | KWW PRZYSZŁOŚĆ | |
| Type of committee: | Election committees established by electors | |
| Address: | Katowicka 23, 45-061, Opole | |
| Plenipotentiary: | electoral | financial |
| Jan Mizera | Krystyna Śliwka | |
The provinces where the committee has submitted lists of candidates
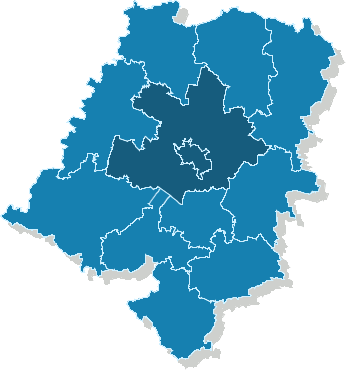
| Name |
|---|
| m. Opole |
| pow. opolski |
The statistics of election committe
Lists submitted
| Description | Number of |
|---|---|
| Number of lists submitted for province council | 0 |
| Number of lists submitted for county councils | 0 |
| Number of lists submitted for councils of cities holding county rights | 5 |
| Number of lists submitted for districts councils of the cap. city of Warsaw | 0 |
| Number of lists registered for communal councils | 2 |
| Totalling | 7 |
Submitted candidates
| Name | Number of candidates | Women | Women (%) | Men | Men (%) |
|---|---|---|---|---|---|
| Number of candidates submitted for the province council | 0 | 0 | - | 0 | - |
| Number of candidates submitted for county councils | 0 | 0 | - | 0 | - |
| Number of candidates submitted for councils of cities holding county rights | 27 | 5 | 18.52% | 22 | 81.48% |
| Number of candidates submitted for districts councils of the cap. city of Warsaw | 0 | 0 | - | 0 | - |
| Number of candidates registered for communal councils | 12 | 1 | 8.33% | 11 | 91.67% |
| Number of candidates submitted for reeve, mayor and presidential elections | 1 | 0 | 0.00% | 1 | 100.00% |
| Totalling | 40 | 6 | 15.00% | 34 | 85.00% |
Average age of submitted candidates
| Name | Average age | Average age of women | Average age of men |
|---|---|---|---|
| Average age of candidates submitted for the province council | - | - | - |
| Average age of candidates submitted for county councils | - | - | - |
| Average age of candidates for councils of cities holding county rights | 55 | 55 | 55 |
| Average age of candidates for districts councils of the cap. city of Warsaw | - | - | - |
| Average age of candidates submitted for communal councils | 44 | 48 | 44 |
| Average age of candidates for reeve, mayor, president | 44 | - | 44 |
| Totalling | 52 | 54 | 51 |
Submitted candidates grouped by age
| Name | Number of candidates | Women | Women (%) | Men | Men (%) |
|---|---|---|---|---|---|
| 18-29 | 1 | 0 | 0.00% | 1 | 100.00% |
| 30-39 | 6 | 0 | 0.00% | 6 | 100.00% |
| 40-49 | 12 | 4 | 33.33% | 8 | 66.67% |
| 50-59 | 8 | 0 | 0.00% | 8 | 100.00% |
| 60-69 | 10 | 1 | 10.00% | 9 | 90.00% |
| 70+ | 3 | 1 | 33.33% | 2 | 66.67% |
The youngest and oldest candidate submitted
| Age | Institution | |
|---|---|---|
| Youngest | 24 | Rada Miejska w Ozimku |
| Oldest | 71 | Rada Miasta Opola |