Komitet Wyborczy Wyborców "SAMORZĄDOWIEC 2006"
| Name: | Komitet Wyborczy Wyborców "SAMORZĄDOWIEC 2006" | |
| Short name: | KWW "SAMORZĄDOWIEC 2006" | |
| Type of committee: | Election committees established by electors | |
| Address: | ul. Dworcowa 14, 82-100 Nowy Dwór Gdański | |
| Plenipotentiary: | electoral | financial |
| Józef Sionkowski | Jan Mazur | |
The provinces where the committee has submitted lists of candidates
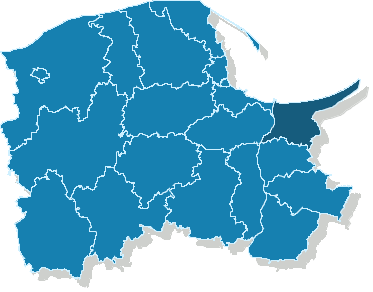
| Name |
|---|
| pow. nowodworski |
The statistics of election committe
Lists submitted
| Description | Number of |
|---|---|
| Number of lists submitted for province council | 0 |
| Number of lists submitted for county councils | 2 |
| Number of lists submitted for councils of cities holding county rights | 0 |
| Number of lists submitted for districts councils of the cap. city of Warsaw | 0 |
| Number of lists registered for communal councils | 17 |
| Totalling | 19 |
Submitted candidates
| Name | Number of candidates | Women | Women (%) | Men | Men (%) |
|---|---|---|---|---|---|
| Number of candidates submitted for the province council | 0 | 0 | - | 0 | - |
| Number of candidates submitted for county councils | 27 | 8 | 29.63% | 19 | 70.37% |
| Number of candidates submitted for councils of cities holding county rights | 0 | 0 | - | 0 | - |
| Number of candidates submitted for districts councils of the cap. city of Warsaw | 0 | 0 | - | 0 | - |
| Number of candidates registered for communal councils | 20 | 9 | 45.00% | 11 | 55.00% |
| Number of candidates submitted for reeve, mayor and presidential elections | 2 | 0 | 0.00% | 2 | 100.00% |
| Totalling | 49 | 17 | 34.69% | 32 | 65.31% |
Average age of submitted candidates
| Name | Average age | Average age of women | Average age of men |
|---|---|---|---|
| Average age of candidates submitted for the province council | - | - | - |
| Average age of candidates submitted for county councils | 46 | 40 | 48 |
| Average age of candidates for councils of cities holding county rights | - | - | - |
| Average age of candidates for districts councils of the cap. city of Warsaw | - | - | - |
| Average age of candidates submitted for communal councils | 43 | 40 | 45 |
| Average age of candidates for reeve, mayor, president | 46 | - | 46 |
| Totalling | 44 | 40 | 47 |
Submitted candidates grouped by age
| Name | Number of candidates | Women | Women (%) | Men | Men (%) |
|---|---|---|---|---|---|
| 18-29 | 5 | 2 | 40.00% | 3 | 60.00% |
| 30-39 | 13 | 8 | 61.54% | 5 | 38.46% |
| 40-49 | 9 | 3 | 33.33% | 6 | 66.67% |
| 50-59 | 18 | 3 | 16.67% | 15 | 83.33% |
| 60-69 | 4 | 1 | 25.00% | 3 | 75.00% |
| 70+ | 0 | 0 | — | 0 | — |
The youngest and oldest candidate submitted
| Age | Institution | |
|---|---|---|
| Youngest | 26 | Rada Miejska w Nowym Dworze Gdańskim |
| Oldest | 61 | Rada Miejska w Nowym Dworze Gdańskim |