Komitet Wyborczy Liga Polskich Rodzin
| Name: | Komitet Wyborczy Liga Polskich Rodzin | |
| Short name: | KW Liga Polskich Rodzin | |
| Type of committee: | Election committees established by political parties | |
| Address: | ul. Hoża 9, 00-528 Warszawa | |
| Plenipotentiary: | electoral | financial |
| Paweł Adam Sulowski | Marta Barbara Zanin | |
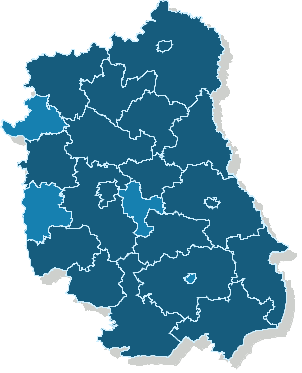
The provinces where the committee has submitted lists of candidates

Sejmik Województwa Lubelskiego
Submitted candidates
| Name | Number of candidates | Women | Women (%) | Men | Men (%) | Status |
|---|---|---|---|---|---|---|
| Sum: | 58 | 15 | 25.86% | 43 | 74.14% | |
| Constituency no. 1 | 9 | 3 | 33.33% | 6 | 66.67% |
|
| Constituency no. 2 | 15 | 4 | 26.67% | 11 | 73.33% |
|
| Constituency no. 3 | 11 | 3 | 27.27% | 8 | 72.73% |
|
| Constituency no. 4 | 12 | 3 | 25.00% | 9 | 75.00% |
|
| Constituency no. 5 | 11 | 2 | 18.18% | 9 | 81.82% |
|
Age of the candidates
| Name | Average age | Average age of women | Average age of men | Oldest | Youngest |
|---|---|---|---|---|---|
| Constituency no. 1 | 43 | 61 | 35 | 65 | 18 |
| Constituency no. 2 | 42 | 55 | 38 | 76 | 19 |
| Constituency no. 3 | 46 | 46 | 47 | 83 | 21 |
| Constituency no. 4 | 36 | 44 | 34 | 60 | 22 |
| Constituency no. 5 | 42 | 54 | 39 | 83 | 21 |
The statistics of election committe
Lists submitted
| Description | Number of |
|---|---|
| Number of lists submitted for province council | 5 |
| Number of lists submitted for county councils | 62 |
| Number of lists submitted for councils of cities holding county rights | 14 |
| Number of lists registered for communal councils | 272 |
| Totalling | 353 |
Submitted candidates
| Name | Number of candidates | Women | Women (%) | Men | Men (%) |
|---|---|---|---|---|---|
| Number of candidates submitted for the province council | 58 | 15 | 25.86% | 43 | 74.14% |
| Number of candidates submitted for county councils | 373 | 114 | 30.56% | 259 | 69.44% |
| Number of candidates submitted for councils of cities holding county rights | 149 | 51 | 34.23% | 98 | 65.77% |
| Number of candidates registered for communal councils | 462 | 163 | 35.28% | 299 | 64.72% |
| Number of candidates submitted for reeve, mayor and presidential elections | 22 | 2 | 9.09% | 20 | 90.91% |
| Totalling | 1,064 | 345 | 32.42% | 719 | 67.58% |
Average age of submitted candidates
| Name | Average age | Average age of women | Average age of men |
|---|---|---|---|
| Average age of candidates submitted for the province council | 42 | 52 | 38 |
| Average age of candidates submitted for county councils | 44 | 43 | 45 |
| Average age of candidates for councils of cities holding county rights | 42 | 45 | 41 |
| Average age of candidates submitted for communal councils | 43 | 42 | 43 |
| Average age of candidates for reeve, mayor, president | 42 | 47 | 42 |
| Totalling | 43 | 43 | 43 |
Submitted candidates grouped by age
| Name | Number of candidates | Women | Women (%) | Men | Men (%) |
|---|---|---|---|---|---|
| 18-29 | 172 | 49 | 28.49% | 123 | 71.51% |
| 30-39 | 212 | 78 | 36.79% | 134 | 63.21% |
| 40-49 | 335 | 110 | 32.84% | 225 | 67.16% |
| 50-59 | 243 | 85 | 34.98% | 158 | 65.02% |
| 60-69 | 80 | 20 | 25.00% | 60 | 75.00% |
| 70+ | 22 | 3 | 13.64% | 19 | 86.36% |
The youngest and oldest candidate submitted
| Age | Institution | |
|---|---|---|
| Youngest | 18 | Rada Miasta Tomaszów Lubelski |
| Oldest | 83 | Sejmik Województwa Lubelskiego |