Komitet Wyborczy Liga Polskich Rodzin
| Name: | Komitet Wyborczy Liga Polskich Rodzin | |
| Short name: | KW Liga Polskich Rodzin | |
| Type of committee: | Election committees established by political parties | |
| Address: | ul. Hoża 9, 00-528 Warszawa | |
| Plenipotentiary: | electoral | financial |
| Paweł Adam Sulowski | Marta Barbara Zanin | |
The provinces where the committee has submitted lists of candidates
| Name |
|---|
| m. Bydgoszcz |
| m. Grudziądz |
| m. Włocławek |
| pow. brodnicki |
| pow. bydgoski |
| pow. inowrocławski |
| pow. nakielski |
| pow. radziejowski |
| pow. sępoleński |
| pow. świecki |
| pow. włocławski |
| pow. żniński |
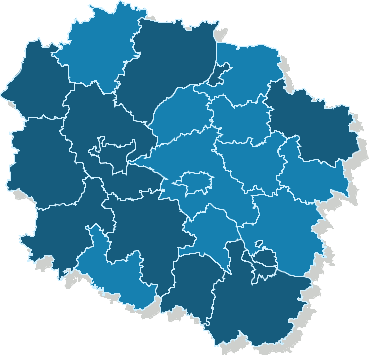
Sejmik Województwa Kujawsko-Pomorskiego
Submitted candidates
| Name | Number of candidates | Women | Women (%) | Men | Men (%) | Status |
|---|---|---|---|---|---|---|
| Sum: | 56 | 20 | 35.71% | 36 | 64.29% | |
| Constituency no. 1 | 12 | 4 | 33.33% | 8 | 66.67% |
|
| Constituency no. 2 | 9 | 5 | 55.56% | 4 | 44.44% |
|
| Constituency no. 3 | 7 | 3 | 42.86% | 4 | 57.14% |
|
| Constituency no. 4 | 9 | 3 | 33.33% | 6 | 66.67% |
|
| Constituency no. 5 | 10 | 2 | 20.00% | 8 | 80.00% |
|
| Constituency no. 6 | 9 | 3 | 33.33% | 6 | 66.67% |
|
Age of the candidates
| Name | Average age | Average age of women | Average age of men | Oldest | Youngest |
|---|---|---|---|---|---|
| Constituency no. 1 | 48 | 48 | 49 | 76 | 19 |
| Constituency no. 2 | 42 | 43 | 42 | 60 | 20 |
| Constituency no. 3 | 47 | 42 | 50 | 79 | 30 |
| Constituency no. 4 | 34 | 41 | 30 | 58 | 19 |
| Constituency no. 5 | 45 | 36 | 48 | 64 | 27 |
| Constituency no. 6 | 42 | 36 | 45 | 57 | 24 |
The statistics of election committe
Lists submitted
| Description | Number of |
|---|---|
| Number of lists submitted for province council | 6 |
| Number of lists submitted for county councils | 13 |
| Number of lists submitted for councils of cities holding county rights | 14 |
| Number of lists registered for communal councils | 27 |
| Totalling | 60 |
Submitted candidates
| Name | Number of candidates | Women | Women (%) | Men | Men (%) |
|---|---|---|---|---|---|
| Number of candidates submitted for the province council | 56 | 20 | 35.71% | 36 | 64.29% |
| Number of candidates submitted for county councils | 57 | 24 | 42.11% | 33 | 57.89% |
| Number of candidates submitted for councils of cities holding county rights | 107 | 42 | 39.25% | 65 | 60.75% |
| Number of candidates registered for communal councils | 42 | 13 | 30.95% | 29 | 69.05% |
| Number of candidates submitted for reeve, mayor and presidential elections | 1 | 0 | 0.00% | 1 | 100.00% |
| Totalling | 263 | 99 | 37.64% | 164 | 62.36% |
Average age of submitted candidates
| Name | Average age | Average age of women | Average age of men |
|---|---|---|---|
| Average age of candidates submitted for the province council | 43 | 42 | 44 |
| Average age of candidates submitted for county councils | 43 | 39 | 46 |
| Average age of candidates for councils of cities holding county rights | 47 | 47 | 47 |
| Average age of candidates submitted for communal councils | 42 | 37 | 44 |
| Average age of candidates for reeve, mayor, president | 44 | - | 44 |
| Totalling | 45 | 43 | 46 |
Submitted candidates grouped by age
| Name | Number of candidates | Women | Women (%) | Men | Men (%) |
|---|---|---|---|---|---|
| 18-29 | 45 | 20 | 44.44% | 25 | 55.56% |
| 30-39 | 49 | 18 | 36.73% | 31 | 63.27% |
| 40-49 | 66 | 27 | 40.91% | 39 | 59.09% |
| 50-59 | 68 | 26 | 38.24% | 42 | 61.76% |
| 60-69 | 23 | 5 | 21.74% | 18 | 78.26% |
| 70+ | 12 | 3 | 25.00% | 9 | 75.00% |
The youngest and oldest candidate submitted
| Age | Institution | |
|---|---|---|
| Youngest | 18 | Rada Miasta Bydgoszczy |
| Oldest | 80 | Rada Miasta Bydgoszczy |