Komitet Wyborczy Wyborców Samorządowy Komitet Wyborczy - SKW
| Name: | Komitet Wyborczy Wyborców Samorządowy Komitet Wyborczy - SKW | |
| Short name: | KWW SKW | |
| Type of committee: | Election committees established by electors | |
| Address: | ul. Księżycowa 10, 05-200 Zagościniec | |
| Plenipotentiary: | electoral | financial |
| Marek Górski | Ewa Zych | |
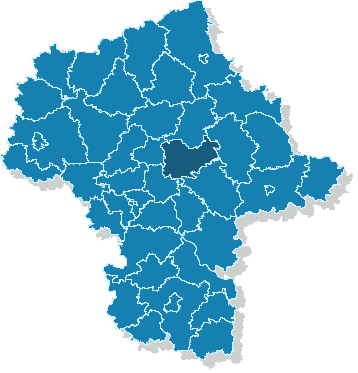
The provinces where the committee has submitted lists of candidates
| Name |
|---|
| pow. wołomiński |
The statistics of election committe
Lists submitted
| Description | Number of |
|---|---|
| Number of lists submitted for province council | 0 |
| Number of lists submitted for county councils | 7 |
| Number of lists submitted for councils of cities holding county rights | 0 |
| Number of lists submitted for districts councils of the cap. city of Warsaw | 0 |
| Number of lists registered for communal councils | 7 |
| Totalling | 14 |
Submitted candidates
| Name | Number of candidates | Women | Women (%) | Men | Men (%) |
|---|---|---|---|---|---|
| Number of candidates submitted for the province council | 0 | 0 | - | 0 | - |
| Number of candidates submitted for county councils | 49 | 19 | 38.78% | 30 | 61.22% |
| Number of candidates submitted for councils of cities holding county rights | 0 | 0 | - | 0 | - |
| Number of candidates submitted for districts councils of the cap. city of Warsaw | 0 | 0 | - | 0 | - |
| Number of candidates registered for communal councils | 42 | 9 | 21.43% | 33 | 78.57% |
| Number of candidates submitted for reeve, mayor and presidential elections | 1 | 0 | 0.00% | 1 | 100.00% |
| Totalling | 92 | 28 | 30.43% | 64 | 69.57% |
Average age of submitted candidates
| Name | Average age | Average age of women | Average age of men |
|---|---|---|---|
| Average age of candidates submitted for the province council | - | - | - |
| Average age of candidates submitted for county councils | 47 | 47 | 46 |
| Average age of candidates for councils of cities holding county rights | - | - | - |
| Average age of candidates for districts councils of the cap. city of Warsaw | - | - | - |
| Average age of candidates submitted for communal councils | 50 | 53 | 50 |
| Average age of candidates for reeve, mayor, president | 54 | - | 54 |
| Totalling | 48 | 49 | 48 |
Submitted candidates grouped by age
| Name | Number of candidates | Women | Women (%) | Men | Men (%) |
|---|---|---|---|---|---|
| 18-29 | 8 | 1 | 12.50% | 7 | 87.50% |
| 30-39 | 7 | 1 | 14.29% | 6 | 85.71% |
| 40-49 | 30 | 13 | 43.33% | 17 | 56.67% |
| 50-59 | 33 | 8 | 24.24% | 25 | 75.76% |
| 60-69 | 12 | 5 | 41.67% | 7 | 58.33% |
| 70+ | 2 | 0 | 0.00% | 2 | 100.00% |
The youngest and oldest candidate submitted
| Age | Institution | |
|---|---|---|
| Youngest | 19 | Rada Miejska w Wołominie |
| Oldest | 72 | Rada Miejska w Wołominie |