Komitet Wyborczy Wyborców RAZEM DLA TRZEBINI
| Name: | Komitet Wyborczy Wyborców RAZEM DLA TRZEBINI | |
| Short name: | KWW RAZEM DLA TRZEBINI | |
| Type of committee: | Election committees established by electors | |
| Address: | Stojałowskiego 46B, 32-540 Trzebinia | |
| Plenipotentiary: | electoral | financial |
| Aleksander Nowak | Włodzimierz Łęcki | |
The provinces where the committee has submitted lists of candidates
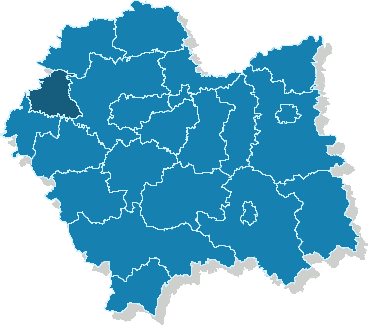
| Name |
|---|
| pow. chrzanowski |
The statistics of election committe
Lists submitted
| Description | Number of |
|---|---|
| Number of lists submitted for province council | 0 |
| Number of lists submitted for county councils | 0 |
| Number of lists submitted for councils of cities holding county rights | 0 |
| Number of lists submitted for districts councils of the cap. city of Warsaw | 0 |
| Number of lists registered for communal councils | 3 |
| Totalling | 3 |
Submitted candidates
| Name | Number of candidates | Women | Women (%) | Men | Men (%) |
|---|---|---|---|---|---|
| Number of candidates submitted for the province council | 0 | 0 | - | 0 | - |
| Number of candidates submitted for county councils | 0 | 0 | - | 0 | - |
| Number of candidates submitted for councils of cities holding county rights | 0 | 0 | - | 0 | - |
| Number of candidates submitted for districts councils of the cap. city of Warsaw | 0 | 0 | - | 0 | - |
| Number of candidates registered for communal councils | 40 | 9 | 22.50% | 31 | 77.50% |
| Number of candidates submitted for reeve, mayor and presidential elections | 1 | 0 | 0.00% | 1 | 100.00% |
| Totalling | 41 | 9 | 21.95% | 32 | 78.05% |
Average age of submitted candidates
| Name | Average age | Average age of women | Average age of men |
|---|---|---|---|
| Average age of candidates submitted for the province council | - | - | - |
| Average age of candidates submitted for county councils | - | - | - |
| Average age of candidates for councils of cities holding county rights | - | - | - |
| Average age of candidates for districts councils of the cap. city of Warsaw | - | - | - |
| Average age of candidates submitted for communal councils | 52 | 52 | 52 |
| Average age of candidates for reeve, mayor, president | 59 | - | 59 |
| Totalling | 52 | 52 | 53 |
Submitted candidates grouped by age
| Name | Number of candidates | Women | Women (%) | Men | Men (%) |
|---|---|---|---|---|---|
| 18-29 | 3 | 0 | 0.00% | 3 | 100.00% |
| 30-39 | 1 | 0 | 0.00% | 1 | 100.00% |
| 40-49 | 8 | 2 | 25.00% | 6 | 75.00% |
| 50-59 | 20 | 6 | 30.00% | 14 | 70.00% |
| 60-69 | 6 | 1 | 16.67% | 5 | 83.33% |
| 70+ | 3 | 0 | 0.00% | 3 | 100.00% |
The youngest and oldest candidate submitted
| Age | Institution | |
|---|---|---|
| Youngest | 24 | Rada Miasta Trzebini |
| Oldest | 77 | Rada Miasta Trzebini |