Komitet Wyborczy Wyborców FORUM WYBORCZE
| Name: | Komitet Wyborczy Wyborców FORUM WYBORCZE | |
| Short name: | KWW FORUM WYBORCZE | |
| Type of committee: | Election committees established by electors | |
| Address: | ul. Portowa 3; 11-600 Węgorzewo | |
| Plenipotentiary: | electoral | financial |
| Lechosław Jan Żynda | Janina Teresa Borowska | |
The counties and cities holding county rights where the committee has submitted lists of candidates
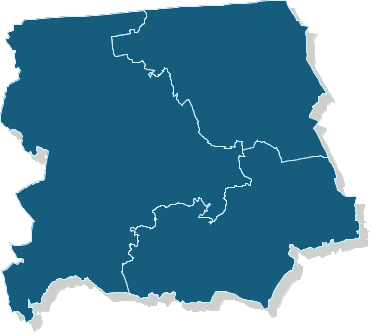
| Name |
|---|
| gm. Budry |
| gm. Pozezdrze |
| gm. Węgorzewo |
Rada Powiatu w Węgorzewie
Submitted candidates
| Name | Number of candidates | Women | Women (%) | Men | Men (%) | Status |
|---|---|---|---|---|---|---|
| Sum: | 30 | 10 | 33.33% | 20 | 66.67% | |
| Constituency no. 1 | 14 | 5 | 35.71% | 9 | 64.29% |
|
| Constituency no. 2 | 8 | 1 | 12.50% | 7 | 87.50% |
|
| Constituency no. 3 | 8 | 4 | 50.00% | 4 | 50.00% |
|
Age of the candidates
| Name | Average age | Average age of women | Average age of men | Oldest | Youngest |
|---|---|---|---|---|---|
| Constituency no. 1 | 44 | 45 | 43 | 55 | 30 |
| Constituency no. 2 | 48 | 58 | 47 | 59 | 33 |
| Constituency no. 3 | 49 | 43 | 55 | 59 | 29 |
The statistics of election committe
Lists submitted
| Description | Number of |
|---|---|
| Number of lists submitted for county councils | 3 |
| Number of lists submitted for councils of cities holding county rights | 0 |
| Number of lists registered for communal councils | 7 |
| Totalling | 10 |
Submitted candidates
| Name | Number of candidates | Women | Women (%) | Men | Men (%) |
|---|---|---|---|---|---|
| Number of candidates submitted for county councils | 30 | 10 | 33.33% | 20 | 66.67% |
| Number of candidates submitted for councils of cities holding county rights | 0 | 0 | - | 0 | - |
| Number of candidates registered for communal councils | 13 | 3 | 23.08% | 10 | 76.92% |
| Number of candidates submitted for reeve, mayor and presidential elections | 0 | 0 | - | 0 | - |
| Totalling | 43 | 13 | 30.23% | 30 | 69.77% |
Average age of submitted candidates
| Name | Average age | Average age of women | Average age of men |
|---|---|---|---|
| Average age of candidates submitted for county councils | 46 | 46 | 47 |
| Average age of candidates for councils of cities holding county rights | - | - | - |
| Average age of candidates submitted for communal councils | 40 | 36 | 41 |
| Average age of candidates for reeve, mayor, president | - | - | - |
| Totalling | 44 | 43 | 45 |
Submitted candidates grouped by age
| Name | Number of candidates | Women | Women (%) | Men | Men (%) |
|---|---|---|---|---|---|
| 18-29 | 2 | 2 | 100.00% | 0 | 0.00% |
| 30-39 | 11 | 2 | 18.18% | 9 | 81.82% |
| 40-49 | 12 | 3 | 25.00% | 9 | 75.00% |
| 50-59 | 18 | 6 | 33.33% | 12 | 66.67% |
| 60-69 | 0 | 0 | — | 0 | — |
| 70+ | 0 | 0 | — | 0 | — |
The youngest and oldest candidate submitted
| Age | Institution | |
|---|---|---|
| Youngest | 28 | Rada Gminy w Budrach |
| Oldest | 59 | Rada Powiatu w Węgorzewie |