Komitet Wyborczy Wyborców "Dla rozwoju miasta Łańcuta i powiatu"
| Name: | Komitet Wyborczy Wyborców "Dla rozwoju miasta Łańcuta i powiatu" | |
| Short name: | KWW Szansa dla Łańcuta i powiatu | |
| Type of committee: | Election committees established by electors | |
| Address: | ul. Piłsudskiego 9/21, 37-100 Łańcut | |
| Plenipotentiary: | electoral | financial |
| Henryk Pazdan | Grzegorz Wilk | |
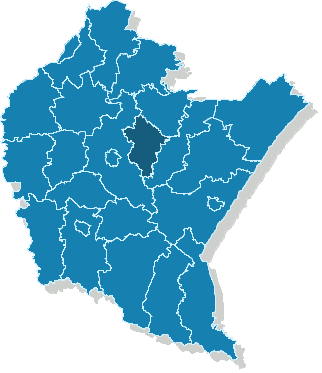
The provinces where the committee has submitted lists of candidates
| Name |
|---|
| pow. łańcucki |
The statistics of election committe
Lists submitted
| Description | Number of |
|---|---|
| Number of lists submitted for province council | 0 |
| Number of lists submitted for county councils | 4 |
| Number of lists submitted for councils of cities holding county rights | 0 |
| Number of lists submitted for districts councils of the cap. city of Warsaw | 0 |
| Number of lists registered for communal councils | 13 |
| Totalling | 17 |
Submitted candidates
| Name | Number of candidates | Women | Women (%) | Men | Men (%) |
|---|---|---|---|---|---|
| Number of candidates submitted for the province council | 0 | 0 | - | 0 | - |
| Number of candidates submitted for county councils | 38 | 11 | 28.95% | 27 | 71.05% |
| Number of candidates submitted for councils of cities holding county rights | 0 | 0 | - | 0 | - |
| Number of candidates submitted for districts councils of the cap. city of Warsaw | 0 | 0 | - | 0 | - |
| Number of candidates registered for communal councils | 29 | 7 | 24.14% | 22 | 75.86% |
| Number of candidates submitted for reeve, mayor and presidential elections | 2 | 0 | 0.00% | 2 | 100.00% |
| Totalling | 69 | 18 | 26.09% | 51 | 73.91% |
Average age of submitted candidates
| Name | Average age | Average age of women | Average age of men |
|---|---|---|---|
| Average age of candidates submitted for the province council | - | - | - |
| Average age of candidates submitted for county councils | 46 | 47 | 45 |
| Average age of candidates for councils of cities holding county rights | - | - | - |
| Average age of candidates for districts councils of the cap. city of Warsaw | - | - | - |
| Average age of candidates submitted for communal councils | 49 | 54 | 48 |
| Average age of candidates for reeve, mayor, president | 50 | - | 50 |
| Totalling | 47 | 50 | 46 |
Submitted candidates grouped by age
| Name | Number of candidates | Women | Women (%) | Men | Men (%) |
|---|---|---|---|---|---|
| 18-29 | 4 | 0 | 0.00% | 4 | 100.00% |
| 30-39 | 15 | 4 | 26.67% | 11 | 73.33% |
| 40-49 | 19 | 5 | 26.32% | 14 | 73.68% |
| 50-59 | 21 | 7 | 33.33% | 14 | 66.67% |
| 60-69 | 7 | 0 | 0.00% | 7 | 100.00% |
| 70+ | 3 | 2 | 66.67% | 1 | 33.33% |
The youngest and oldest candidate submitted
| Age | Institution | |
|---|---|---|
| Youngest | 20 | Rada Powiatu Łańcuckiego |
| Oldest | 78 | Rada Miejska w Łańcucie |