Komitet Wyborczy Wyborców FORUM LEWICOWO-DEMOKRATYCZNE
| Name: | Komitet Wyborczy Wyborców FORUM LEWICOWO-DEMOKRATYCZNE | |
| Short name: | KWW FORUM LEWICOWO-DEMOKRATYCZNE | |
| Type of committee: | Election committees established by electors | |
| Address: | ul. Kaliska 42, 99-100 Łęczyca | |
| Plenipotentiary: | electoral | financial |
| Jolanta Wawrzyniak | Małgorzata Horodecka | |
The provinces where the committee has submitted lists of candidates
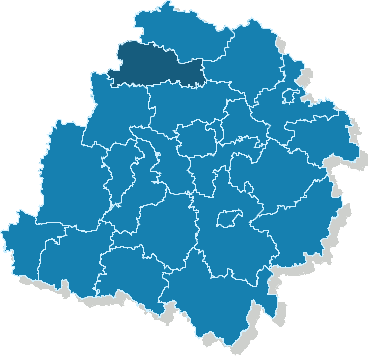
| Name |
|---|
| pow. łęczycki |
The statistics of election committe
Lists submitted
| Description | Number of |
|---|---|
| Number of lists submitted for province council | 0 |
| Number of lists submitted for county councils | 4 |
| Number of lists submitted for councils of cities holding county rights | 0 |
| Number of lists submitted for districts councils of the cap. city of Warsaw | 0 |
| Number of lists registered for communal councils | 35 |
| Totalling | 39 |
Submitted candidates
| Name | Number of candidates | Women | Women (%) | Men | Men (%) |
|---|---|---|---|---|---|
| Number of candidates submitted for the province council | 0 | 0 | - | 0 | - |
| Number of candidates submitted for county councils | 31 | 7 | 22.58% | 24 | 77.42% |
| Number of candidates submitted for councils of cities holding county rights | 0 | 0 | - | 0 | - |
| Number of candidates submitted for districts councils of the cap. city of Warsaw | 0 | 0 | - | 0 | - |
| Number of candidates registered for communal councils | 42 | 9 | 21.43% | 33 | 78.57% |
| Number of candidates submitted for reeve, mayor and presidential elections | 1 | 0 | 0.00% | 1 | 100.00% |
| Totalling | 74 | 16 | 21.62% | 58 | 78.38% |
Average age of submitted candidates
| Name | Average age | Average age of women | Average age of men |
|---|---|---|---|
| Average age of candidates submitted for the province council | - | - | - |
| Average age of candidates submitted for county councils | 48 | 39 | 50 |
| Average age of candidates for councils of cities holding county rights | - | - | - |
| Average age of candidates for districts councils of the cap. city of Warsaw | - | - | - |
| Average age of candidates submitted for communal councils | 42 | 43 | 42 |
| Average age of candidates for reeve, mayor, president | 50 | - | 50 |
| Totalling | 45 | 41 | 46 |
Submitted candidates grouped by age
| Name | Number of candidates | Women | Women (%) | Men | Men (%) |
|---|---|---|---|---|---|
| 18-29 | 16 | 5 | 31.25% | 11 | 68.75% |
| 30-39 | 6 | 1 | 16.67% | 5 | 83.33% |
| 40-49 | 19 | 4 | 21.05% | 15 | 78.95% |
| 50-59 | 26 | 4 | 15.38% | 22 | 84.62% |
| 60-69 | 5 | 2 | 40.00% | 3 | 60.00% |
| 70+ | 2 | 0 | 0.00% | 2 | 100.00% |
The youngest and oldest candidate submitted
| Age | Institution | |
|---|---|---|
| Youngest | 22 | Rada Gminy Grabów |
| Oldest | 70 | Rada Powiatu Łęczyckiego |