Komitet Wyborczy Stowarzyszenia "Lubię Kraśnik"
| Name: | Komitet Wyborczy Stowarzyszenia "Lubię Kraśnik" | |
| Short name: | KW Stowarzyszenia "Lubię Kraśnik" | |
| Type of committee: | Election committees established by organisations | |
| Address: | al. Niepodległości 19/29, 23-210 Kraśnik | |
| Plenipotentiary: | electoral | financial |
| Piotr Mazurek | Anna Barbara Żuraw | |
The provinces where the committee has submitted lists of candidates
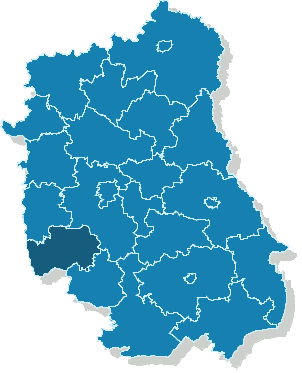
| Name |
|---|
| pow. kraśnicki |
The statistics of election committe
Lists submitted
| Description | Number of |
|---|---|
| Number of lists submitted for province council | 0 |
| Number of lists submitted for county councils | 4 |
| Number of lists submitted for councils of cities holding county rights | 0 |
| Number of lists submitted for districts councils of the cap. city of Warsaw | 0 |
| Number of lists registered for communal councils | 4 |
| Totalling | 8 |
Submitted candidates
| Name | Number of candidates | Women | Women (%) | Men | Men (%) |
|---|---|---|---|---|---|
| Number of candidates submitted for the province council | 0 | 0 | - | 0 | - |
| Number of candidates submitted for county councils | 46 | 8 | 17.39% | 38 | 82.61% |
| Number of candidates submitted for councils of cities holding county rights | 0 | 0 | - | 0 | - |
| Number of candidates submitted for districts councils of the cap. city of Warsaw | 0 | 0 | - | 0 | - |
| Number of candidates registered for communal councils | 42 | 13 | 30.95% | 29 | 69.05% |
| Number of candidates submitted for reeve, mayor and presidential elections | 1 | 0 | 0.00% | 1 | 100.00% |
| Totalling | 89 | 21 | 23.60% | 68 | 76.40% |
Average age of submitted candidates
| Name | Average age | Average age of women | Average age of men |
|---|---|---|---|
| Average age of candidates submitted for the province council | - | - | - |
| Average age of candidates submitted for county councils | 40 | 39 | 40 |
| Average age of candidates for councils of cities holding county rights | - | - | - |
| Average age of candidates for districts councils of the cap. city of Warsaw | - | - | - |
| Average age of candidates submitted for communal councils | 42 | 43 | 41 |
| Average age of candidates for reeve, mayor, president | 40 | - | 40 |
| Totalling | 41 | 42 | 41 |
Submitted candidates grouped by age
| Name | Number of candidates | Women | Women (%) | Men | Men (%) |
|---|---|---|---|---|---|
| 18-29 | 11 | 2 | 18.18% | 9 | 81.82% |
| 30-39 | 28 | 6 | 21.43% | 22 | 78.57% |
| 40-49 | 31 | 8 | 25.81% | 23 | 74.19% |
| 50-59 | 16 | 4 | 25.00% | 12 | 75.00% |
| 60-69 | 3 | 1 | 33.33% | 2 | 66.67% |
| 70+ | 0 | 0 | — | 0 | — |
The youngest and oldest candidate submitted
| Age | Institution | |
|---|---|---|
| Youngest | 18 | Rada Miasta Kraśnik |
| Oldest | 68 | Rada Miasta Kraśnik |